

| Home Page | Overview | Site Map | Index | Appendix | Illustration | About | Contact | Update | FAQ |
|
|
supercluster in a slice of the universe with our position at the vertex. This map extends to a depth of 300 million light years (3x1026 cm). It confirmed that the galaxies in the universe are arranged in sheets and walls surrounding large nearly-empty voids. A new study in 2006 has found that spiral galaxies line up like beads on a string, with their spin axes aligned with the filaments that outline voids (Figure 03-01b). The finding supports current galaxy-formation theory, which derives a galaxy's rotation from the uneven distribution of the visible and dark matter from which it coalesces. It predicts a galaxy's axis should be |
Figure 03-01a The Coma Supercluster |
Figure 03-01b Spin of Galaxies |
more-or-less perpendicular to the line between the galaxy and the center of the void. |
 |
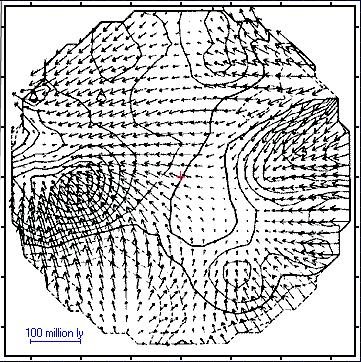 |
of the major galaxy superclusters that surround the Virgo supercluster. These superclusters are not isolated in space but together with many other smaller concentrations of galaxies, they form parts of extensive walls of galaxies surrounding large voids. Three of the biggest walls as well as several of the largest voids are marked on the map. The Virgo along with the Hydra and other superclusters are streaming at a speed of 6x107 cm/sec toward the "Great Attractor" (Figure 03-02b, 2-D plot on galactic plane with Milky Way at the center, arrows show the directions and magnitude of the motion), which is a gigantic unseen mass located near the A3627 (Norma) cluster (Figure 03-02c) in the Centaurus Wall near the galactic plane. In comparison, the speed of |
Figure 03-02a Large Scale Structures |
Figure 03-02b Attractor A3627 |
cosmic expansion is about 7x108 cm/sec at a distance of 100 megapc. (See " Laniakea Supercluster" for news on attractor") |
 |
 |
Figure 03-02d (X-ray: blue; H-alpha: red; Optical: white) is the image of the galaxy ESO 137-001 with a tail that has been created as it plunges toward the center of A3627, shedding material and forming stars behind it. It is estimated that the observed mass of cluster A3627 is not able to account for the huge gravitational attraction exerted on the other clusters. There seems to be something more massive hidden by the dust and gas on the galactic plane represented by the pale blue ribbon of the Milky Way in Figure 03-02c. |
Figure 03-02c Attractor Location |
Figure 03-02d Attraction to A3627 |
 |
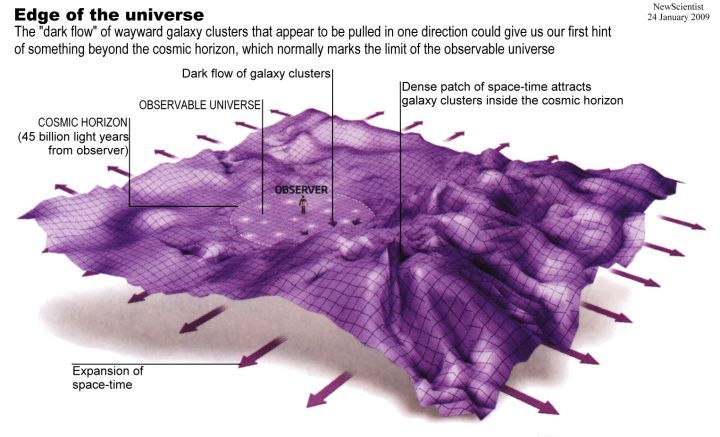 |
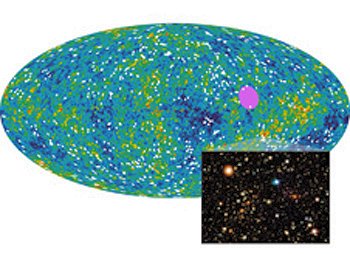
patch of sky near A3627 in the direction between the constellations of Centaurus and Vela (the pink area in Figure 03-02e, also see Figure 03-02c). The clusters show a small but measurable velocity that is independent of the universe's expansion and does not change as distances increase. It is suggested that such motion (now called darkflow) is caused by the gravitational attraction of matter that lies beyond the observable universe (Figure 03-02f). Insert in Figure 03-02e shows one of such clusters 1E 0657-56. |
Figure 03-02eUnobser -vable Attractor |
Figure 03-02f Darkflow |
See "Laniakea Supercluster" for the 2014 research on the Great Attractor. |
 |
By analyzing the absorption lines of magnesium and iron atoms from quasars more than ten billion years away, astronomers in 2010 found that the fine structure constant is smaller (by 1/106) on one side of the universe and bigger on the other side with an axis close to the direction of the Darkflow. It is also aligned with a dipole in the abundance of deuterium in the early universe, and another dipole for the intensity of light emitted by supernovae. It is estimated that the chance of being a genuine effect is about 99.9937%, but a scientific discovery traditionally has to be at 99.99937%. If such effect is real, then special relativity has to be revised, and life may not be possible in some parts or epochs of the universe. It also implies that there may be more dimensions as predicted by the superstring theory. |
Figure 03-02g |
The fine structure constant  = e2/c = e2/c = 1/137 is a dimension-less number, which is the embodiment of the constants from the electromagnetic interaction e, special relativity c, and quantum theory . It is related to other fundamental constants such as : = 1/137 is a dimension-less number, which is the embodiment of the constants from the electromagnetic interaction e, special relativity c, and quantum theory . It is related to other fundamental constants such as : |
 c = 2.82x10⁻¹³ cm, where c = (/mc) = 0.363x10⁻¹⁰ cm is the reduced Compton wavelength, which is actually the de Broglie wavelength for the electron moving with moment p = 2
 mc.c/ = 5.3x10⁻⁹ cm.2mc2/2 = -2.17x10⁻¹¹ erg = -13.6 ev.
 (
( )/d
)/d = (c)2(1 + cos2)/2.)n, where n = 1, 2, 3, ... , appears in the S-matrix of all the quantum electromagnetic processes. It is related to the probability of the occurrence of each one. This is actually the consequence of adopting the perturbation expansion for QED.
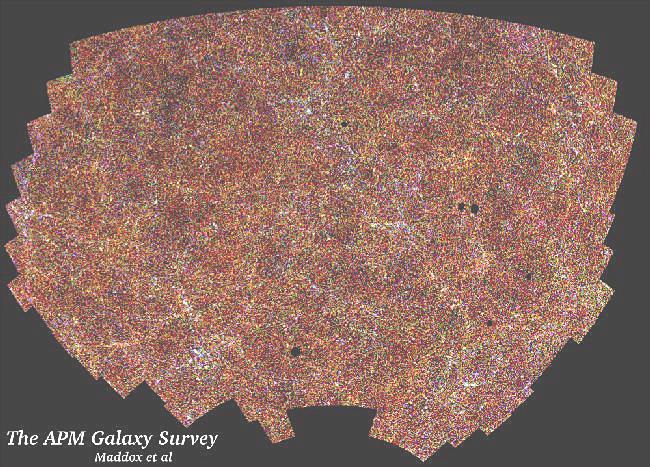 |
Figure 03-03 presents a different view of the large scale structure, which covers a region of sky about 100o by 50o around the South Galactic Pole. The APM (Automatic Plate Measuring) Galaxy Survey contains positions, magnitudes, sizes and shapes for about 3 million galaxies. The picture shows the galaxy distribution as a density map on the sky. Each pixel covers a small patch of sky 0.1o on a side, and is shaded according to the number of galaxies within the area: where there are more galaxies, the pixels are brighter. Galaxy clusters, containing hundreds of galaxies closely packed together, are seen as small bright patches. The larger elongated bright areas are superclusters and filaments. |
Figure 03-03 APM Galaxy Survey |
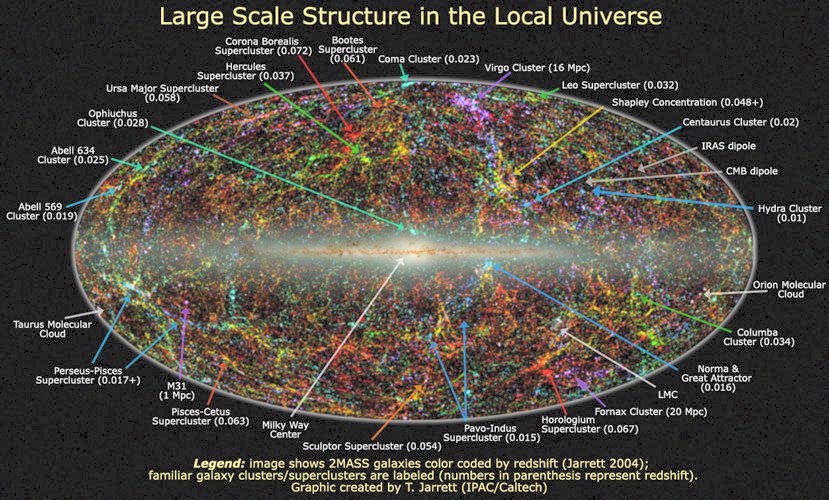 |
each pixel: fainter galaxies are shown as red, intermediate are shown as green and bright are show as blue. The more distant galaxies tend to be fainter, and also show less clustering, and so the maps has a generally uniform reddish background. The more nearby galaxies tend to be bright, and are more clustered, so the more prominent clusters of galaxies in the map tend to show up as blue. The small empty patches in the map are regions that have been excluded around bright stars, nearby dwarf galaxies, and globular clusters. Figure 03-04a shows an all sky distribution produced by the Two Micron All Sky Survey (2MASS) with more than one million galaxies and similar color codes (as the APM). The Milky Way is at the center of the map. |
Figure 03-04a Galaxy Survey, 2MASS [view large image] |
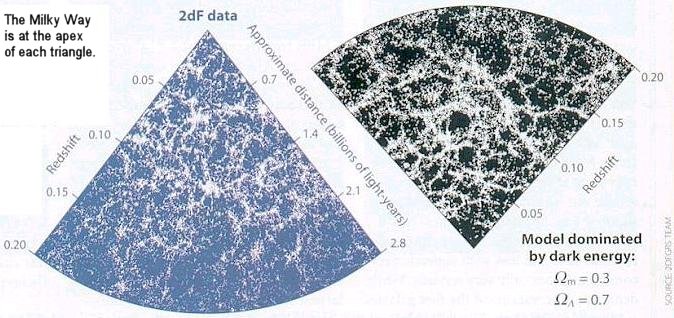 |
The 2dF Galaxy Redshift Survey (completed in 2002) provides yet another view of the large-scale structure as shown in Figure 03-04b. It used the 3.9 meter Anglo-Australian Telescope to obtain spectra for nearly a quarter million galaxies up to redshift of 0.20. The pattern is remarkably similar to the computer simulation assuming the WMAP dark matter and dark energy composition of 30% and 70% respectively. |
Figure 03-04b 2dF Galaxy Survey |


