


| Home Page | Overview | Site Map | Index | Appendix | Illustration | Preface | Contact | Update | FAQ |
|
|
|
and the mass equivalent of their binding energies. It is expressed in units such that the mass of the most abundant type of carbon is exactly 12.00 u (1 u = 1.66x10⁻²⁴ gm). Figure 13-01b is the same table in more colorful style, while Figure 13-01c is another classification scheme by filling up the electron configuration according to increasing energy levels. |
Figure 13-01a Periodic Table, |
Figure 13-01b Periodic Table, |
Figure 13-01c |
Also see "Extension of the Periodic Table". |
 |
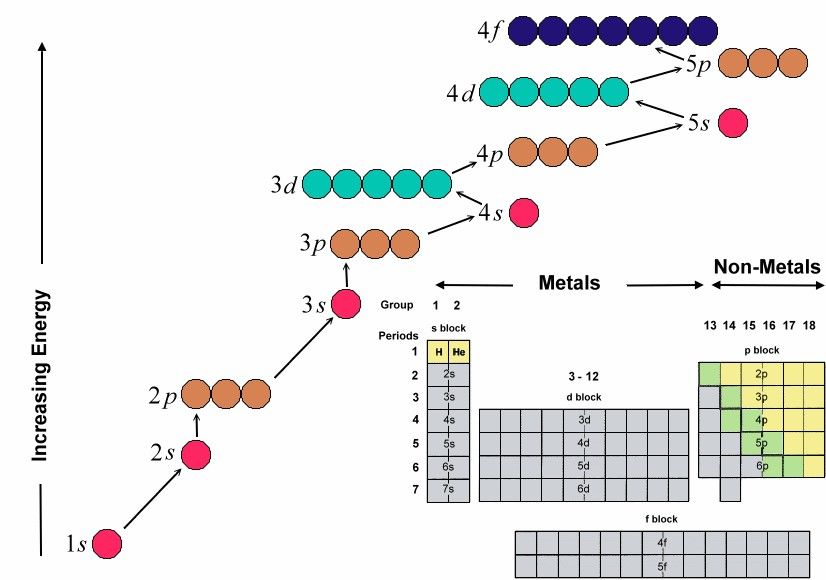
Figure 13-01a includes data for the boiling point, melting point, density, acidity, basicity, crystal structure, and electronegativity (tendency to keep electrons) of the elements. The s, p, d, and f letters in the electronic configuration designate the orbital quantum number l = 0, 1, 2, 3, ... respectively for the outer shell electrons. A new designation of the groups has a number ranged from 1 to 18. Figure 13-01b is an unconventional Periodic Table. It specifies the phase (solid, liquid, or gas) of the element at room temperature, whether the element is radioactive or man-made, as well as its usage (in daily life) or occurrence (in nature). The original version in pdf format, and other Periodic Table in words are available from: http://elements.wlonk.com. Other kinds of Periodic Table may incorporate properties such as atomic radius, covalent radius, ionization potential, specific heat, heat of vaporization, heat of fusion, electrical conductivity, and thermal conductivity etc. The filling sequence in Figure 13-01c shows |
Figure 13-01c1 Periodic Table, Comical |
clearly that the electrons in each atom arrive at their most stable configuration (the ground state) by occupying the lowest possible energy levels.
|
The regular pattern in the periodic table is related to the states of the electrons in an atom. It is specified by four quantum numbers. The principal quantum number n determines the energy level; its value runs from 1, 2, 3, ... For each n, the orbital quantum number l = 0, 1, 2, ... (n-1) designated by s, p, d, ... ; it is related to the magnitude of angular momentum. Then for each l, the magnetic quantum number m can be -l, -l+1, ...l-1, l; it is related to the z component of the angular momentum. The spin quantum number s is either +1/2 or -1/2.
For n = 1, l = 0, m = 0, there is only 2 possible quantum states for the electron, with s = +1/2 and -1/2 respectively. For n = 2, l = 0, m = 0 and l =1, m = -1, 0, +1; there is a total of 2 + 6 = 8 possible quantum states. Therefore, it requires 2 electrons to complete the shell for n = 1, and 8 electrons to complete the shell for n = 2, ...and so on. The orbital quantum number l is often designated by a letter, s for l = 0, p for l = 1, d for l = 2, and f for l = 3 ...
The quantum number l is non-additive (e.g., two of the quantum numbers l1, l2 are added as vectors, they can take on the values of l1+l2, l1+l2-1, ..., |l1-l2| ) while m is additive (e.g., m' = m1 + m2 only) and relates to an Abelian group (e.g., the two dimensional rotation about the z-axis). States having the same non-additive quantum numbers but differing from each other by their additive quantum numbers are said to belong to the same multiplet. The number of members of a multiplet is called its multiplicity. For a given multiplet l the multiplictiy is equal to 2l+1.
 |
When the multiplet levels have the same eigen-energy, they are degenerate, which can be lifted via either external perturbation such as a magnetic field or internally by interaction between parts within the atom. The Zeeman effects in Figure 13-01c2,a shows the interaction between the magnetic field B and the magnetic dipole moment associated with the orbital angular momentum L. It splits a single level |
Figure 13-01c2 Zeeman Effects [view large image] |
with given  (s, p, ...) into levels according to the formula (2+1). However there would not be so many line splitting as the transition is restricted by the selection rule (s, p, ...) into levels according to the formula (2+1). However there would not be so many line splitting as the transition is restricted by the selection rule  ml = 0, ml = 0,  1. Simply put, selection rules are the consequence of something that has to be conserved before and after the transition. 1. Simply put, selection rules are the consequence of something that has to be conserved before and after the transition. |
 |
|
Figure 13-01c3 Fine and Hyperfine Structures [view large image] |
Figure 13-01c3,b shows the interaction between the electron spin and nuclear spin producing splitting of the order 5x10⁻⁶ ev. Astronomers use the 21 cm line emission to plot the hydrogen cloud distribution of the Milky Way (see insert). |
| n | ..., l | ..., (2l+1)x2 | Electron Configuration of the Inert Element |
|---|---|---|---|
| 1 | 0   |
2 | He (2)=2 |
| 2 | 0, 1   |
2, 6 | Ne (2)+(2+6)=10 |
| 3 | 0, 1, 2   |
2, 6, 10 | Ar (2)+(2+6)+(2+6)=18 |
| 4 | 0, 1, 2, 3  |
2, 6, 10, 14 | Kr (2)+(2+6)+(2+6+10)+(2+6)=36 |
| 5 | 0, 1, 2, 3, 4 | 2, 6, 10, 14, 18 | Xe (2)+(2+6)+(2+6+10)+(2+6+10)+(2+6)=54 |
| 6 | 0, 1, 2, 3, 4, 5 | 2, 6, 10, 14, 18, 22 | Rn (2)+(2+6)+(2+6+10)+(2+6+10+14)+(2+6+10)+(2+6)=86 |
 |
 |
calculation defines it as the maximum radial density in the outermost shells. The result is shown in Figure 13-01d for most of the elements. Measured radii are added (within parenthses) for those with missing data. Experimental data are usually obtained by measuring the distance between two atoms (and then divided by 2). It is rather obvious that there are discrepancies in these two kinds of measurements. Figure 13-01e depicts the energy levels of the subshells and the outermost filling blocks (subshells) in the periodic table. |
Figure 13-01d |
Figure 13-01e |
 |
 |
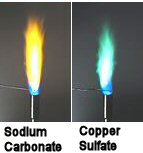
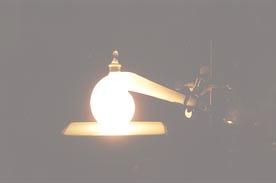
qualitative indicator, since many different metals may emit similar color. A more reliable method is the spectroscope shown in Figure 13-01g. The source is in the form of low pressure gas inside a discharge tube . A slit or two is used to collimate the light into parallel beam (for a sharp image). The different emission lines are separated by a prism. It is widely used in science and engineering. |
Fig. 13-01f Flame Test |
Figure 13-01g Spectroscope |
For example, the emission spectrum of the quasar 3C273 looks suspiciously like the Balmer series spectrum of the hydrogen atom but the wavelength of each line is not the same as the one shown in |
 |
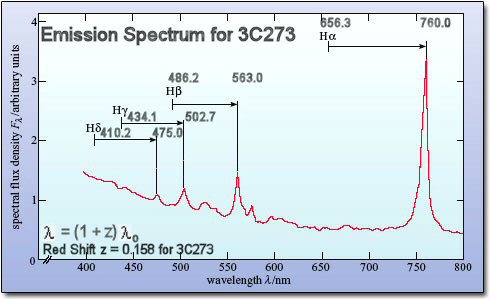 |
Figure 13-01h taken in the laboratory. It turns out that the ratios of the wavelengths are identical, the lines has been red shifted by a factor of (1 + z), where z is the amount of redshift, as the quasar is recessing from us in the cosmic expansion (Figure 13-01i). |
Figure 13-01h Hydrogen Emission Spectrum [view large image] |
Figure 13-01i 3C273 Emission Spectrum [view large image] |
 |
well organized series. Most of the other elements produce randomly distributed emission lines since the displacement of just one electron opening up numerous ways the other electron(s) can jump from one energy level to another. The group 13 elements and a few others seem to be the exception. They appear to be hydrogen-like with one outer electron moving around a core. Figure 13-01j illustrates a few of the possible ways the electrons can move around generating a number of emission lines after an electron at the core has been excited to higher energy level. |
Figure 13-01j Orbitals and Spectrum |
 |
|
Figure 13-01k Problems with Periodic Table [view large image] |
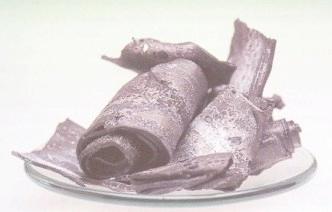 |
Li2O, such that it is never found in its free state in nature. Hydrogen (water creator in Greek), with a solitary electron, nominally belongs in the alkali metals group. However, removal of that single electron requires considerably more energy than for the other alkali metals. Like the halogens, only one additional electron is required to fill in the outermost shell of the hydrogen atom, so hydrogen can be regarded in some respects as behaving like a halogen; its elemental form is a diatomic gas, and it can even form salts (called hydrides) with the alkali metals, where the metal has donated an electron to the hydrogen, almost as if hydrogen were actually a halogen. |
Figure 13-02a Lithium |
 |
|
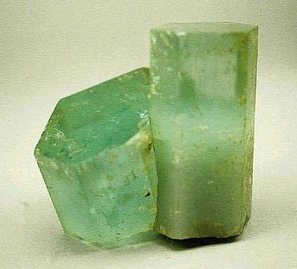
Figure 13-02b Beryl |
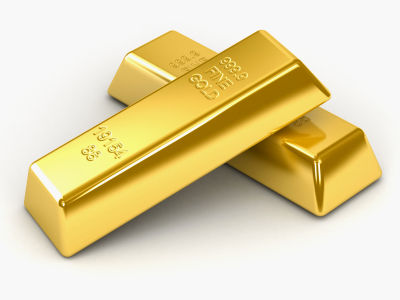 |
densities than group 1 or 2 elements. Group 11 includes the traditional coinage metals such as copper, silver, and gold (see Figure 13-02c). They are also known as the "noble metals". They are all relatively inert, hard-to-corrode metals which have been used for minting coins, hence their name. Many metals form coloured compounds, (e.g., iron pyrite), and many metals have a coloured sheen. These metals, especially silver, have unusual properties that make them essential for industrial applications outside of their monetary or decorative value. They are all excellent conductors of electricity. The most conductive of all metals are silver, copper and gold in that order. Silver is the most thermally conductive element, and is |
Figure 13-02c Gold |
also the most light reflecting element. Silver also has the unusual property that the tarnish on the surface is still highly electrically conductive. |
 |
useful as a cleaning agent and water softener. Aluminum, which is right beneath boron, is by its position a metalloid. But the properties of aluminum are usually those of metals. Aluminum is the most abundant metal and the third most abundant element in the earth's crust. Aluminum is found as aluminum oxide in the ore called bauxite. Aluminum is extremely valuable in industry (see Figure 13-02d). It is light, strong, and does not tarnish in air. It is a good conductor and is used in wiring, airplane parts, household items. The other members of the boron family ...gallium, indium, and thallium, are metals. Gallium shares many chemical properties with aluminum. It is an extremely soft metal that can be cut with a knife. It also has an extremely low melting point of 29.8oC. Gallium arsenide (GaAs) can |
Figure 13-02d Aluminum |
function as a "laser diode" and convert electricity directly into a beam of laser light. |
 |
 |
element in the earth's crust. Silicon is used in glass and in cement. Glass is produced by mixing silica (sand - SiO2), soda ash (sodium carbonate - Na2CO3) and limestone (calcium carbonate - CaCO3) in a ratio of 60:80:5 and heated to the melting point of 2500oF. The final product is a supercooled liquid called glass which can be made to be colourful or to have special property by adding impurities (see Figure 13-02e2). Silicon is also used in solar cells, which convert the energy of sunlight into electric energy. Germanium is a metalloid used in transistors, which are devices found in many electronic instruments, such as radios and televisions. Tin is a metal which |
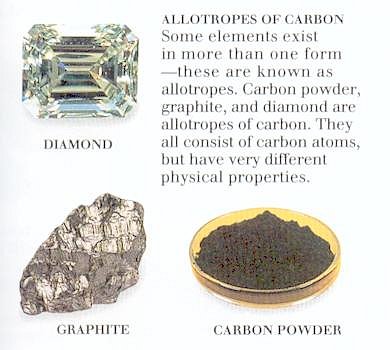
Figure 13-02e1 Carbon |
Figure 13-02e2 Glass |
resists rusting and corrosion. The most dense element in the carbon family is the metal lead (Pb), which can form poisonous compounds. |
 |
dark and bursts into flames in warm air (see Figure 13-02f). It is used in the military to make incendiary bomb. Arsenic is a brittle, crystalline solid at room temperature. It is often thought of as a semi-metal, or metalloid. For example, it is a poor conductor of electricity, yet it has a steel-gray color. In the form of arsenious oxide, it is a well-known poison. It is used as a weed killer and insecticide. Arsenic has become a material of great importance in the world of solid-state electronics. Small amounts of arsenic are added to such semi-conductors as germanium and silicon to transform them into transistors. |
Figure 13-02f Phosphorus |
 |
name is generally considered to mean "ore former" (from the Greek chalcos "ore" and -gen "formation"). Oxygen and sulfur (see Figure 13-02g) are nonmetals, polonium is a true metal, and selenium and tellurium are metalloid semiconductors (i.e., their electrical properties are between those of a metal and an insulator). Nevertheless, tellurium, as well as selenium, is often referred to as a metal when in elemental form. Chalcogenides are quite common as minerals, e.g., FeS2 pyrite is an iron ore and AuTe2 gave its name to the gold rush town of Telluride, Colorado in the USA. The oxidation number of the chalcogen is generally -2 in a chalcogenide but other values (e.g. -1 in pyrite) can be attained. The highest oxidation number +6 is found in sulfates, selenates and tellurates, e.g., in Na2SeO4 - sodium selenate. |
Figure 13-02g Sulfur |
 |
most carbon-containing, or organohalogen, molecules. Organohalogen chemicals (such as DDT, PCB, CFC, ...) are often believed to be solely industrial compounds, but many living organisms and geological phenomena also produce them naturally. In the case of plants and animls (such as sponges, corals, seaweeds, evergreen trees, some arthropods, and some frogs), the substance is produced for defence against predators and parasites. The halogens become less reactive, and their melting points increase further down the group. For example, fluorine is a yellow gas at room temperature, whereas bromine is a liquid, and iodine is a black solid (see Figure 13-02h). |
Figure 13- | 02h Iodine |
 |
 |
The 21st century ushers in an era of handheld electronics and green machines. The new technologies use materials other than the traditional steel or gold. Suddenly some obscure metals appear on the scene (or laterally on the touchscreen). These elements used to be the by-products of smelting. Now they are the primary ores in short supplies as demand soared. |
Figure 13-02j High-tech Elements [view large image] |
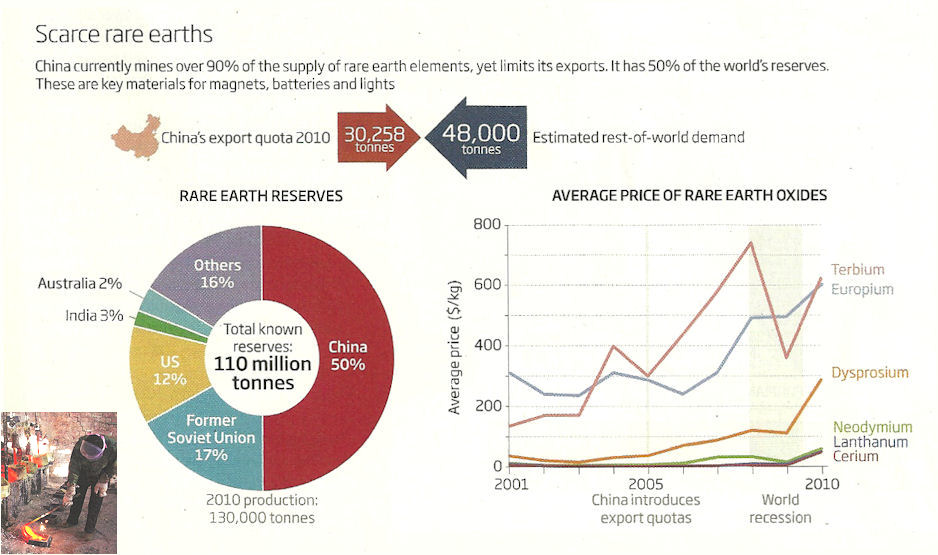
Figure 13-02k Export Quota [view large image] |
In 2010, the US Department of Energy compiled a list of 14 high-tech elements in danger of supply disruption for the green technology (Figure 13-02j). |
 |
One of the problems is the introduction of export quotas by China (Figure 13-02k), which currently mines over 90% of the supply of rare earth elements. The insert in Figure 13-02k shows the low-tech smelting of lanthanum in Inner Mongolia. In theory the shortfall could be covered by reopening some of those closed ores suspended over environmental concerns about radioactive contamination or toxicity. Another way is to recycle the used parts. |
Figure 13-02l Recycling Electronic Junks |
But the process would ruin the place and poison its inhabitants as shown in Figures 13-02l taken from a remote village in South-East China. Figure 13-02j also shows the special (and wonderful) properties of some high-tech elements. |
