Metabolic Rate and Kleiber's Law

Metabolic Rate Metabolic Rate, Small Size The first accurate measurements of body mass versus metabolic rate in 1932 shows that the metabolic rate R for all organisms follows exactly the 3/4 power-law of the body mass, i.e., R M3/4. This is known as the Kleiber's Law. It holds good from the smallest bacterium to the largest animal (see Figure 01). The relation remains valid even down to the individual components of a single cell such as the mitochondrion, and the respiratory complexes (a subunit of the mitochondrion) as shown in Figure 02. It works for

Figure 01 Metabolic Rate
[view large image]

Figure 02 Small Size MR[view large image]

plants as well. This is one of the few all-encompassing principles in biology. But the law's universality is baffling: Why should so many species, with their variety of body plans, follow the same rules?
Fractal in Nature Then in 1997, a couple of physicist and biologists successfully derive the 3/4 power-law using the concept of fractal. The theory considers the fact that the tissues of large organisms have a supply problem. That is what blood systems in animals and vascular plants are all about: transporting materials to and from tissues. Small organisms don't face the problem to the same extent. A very small organism has such a large surface area compared to its volume that it can get all the oxygen it needs through its body wall. Even if it is multicellular, none of its cells are very far from the outside body wall. But a large organism has a transport problem because most of its cells are far away from the supplies they need. Insects literally pipe air into their tissues in a branching network of tubes called tracheae. Mammals have richly branched air tubes, but they are confined to special organs, the lungs. Fish do a similar thing with gills. Trees use their richly dividing branches to supply their leaves with water and pump sugars back from the leaves to the trunk. The 3/4-power law is derived in part from the assumption that mammalian

Figure 03 Fractal in Nature
[view large image]

distribution networks are "fractal like" (Figure 03) and in part from the conjecture that natural selection has tended to maximize metabolic capacity "by maintaining networks that occupy a fixed percentage (6 - 7%) of the volume of the body".
Effort has been made to derive the 3/4 power-law for a broader category that includes plants, animals, and even one-celled organisms lacking a vascular system. The latest derivation is based mostly on geometry, particularly the hierarchical nature of circulatory networks. It is argued that an organism's "internal area" -- the total area of its capillary walls -- fills up space so efficiently that it, in effect, adds a third dimension (similar to the compactification of extra dimensions in the Superstring Theory). Therefore, the "internal volume" of all the vessels feeding the capillaries acts as an extra dimension, scaling as the fourth power of internal length.
Life Span Brain Mass 
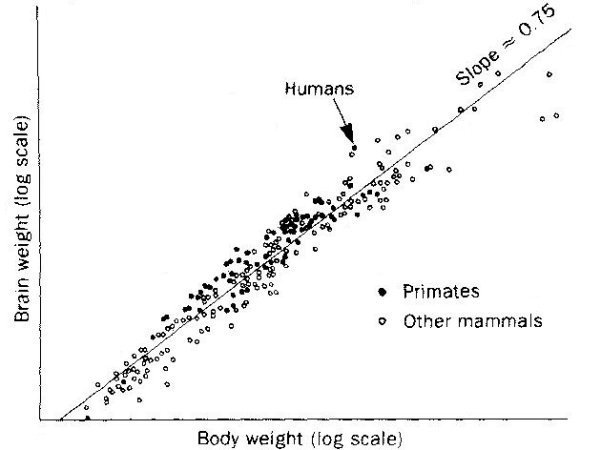
There is a more general 1/4 power-law applicable to many physicological variables y as shown in Figures 04, 05, and Table 01. The general form of the power-law is y Mb, where b is a multiple of 1/4. It seems that all these physicological variables have something to do with the nutrient distribution networks and the dimensional dependence. For example, the life span is proportional to the linear dimension L, and the heart beat rate is related to the inverse L-1. The other variables simply follow the same 3/4 power-law or L3 as for the case of metabolic rate. It is obvious that the

Figure 04 Life Span
[view large image]

Figure 05 Brain Mass
[view large image]

various physicological variables are determined primarily by the dimensional dependence. The corresponding power-laws are the consequence of the relationship L M1/4.


physiological variables (y) Dimension scaling exponent (b)
Heart Beat Rate -1 -1/4
Period of Heart Beat§ 1 1/4
Life Span 1 1/4
Diameter of Tree Trunks 3 3/4
Diameter of Aortas 3 3/4
Brain Mass 3 3/4
Metabolic Rate 3 3/4
Metabolic Rate (latest observations) 4 1

Table 01 The 1/4 Power-Law


Plant Mass A report in the January 26, 2006 issue of Nature indicates that the 3/4 power law is not observed in plants. The new experiment involved 500 individual plants, across 43 species, from varying environments, and covering six orders of magnitude variation in plant mass. It is found that the slope for a plot with respiration (metabolic rate) against plant mass is close to 1 (see Figure 06). The differences in the intercepts between the indoor and outdoor groups disappears if plant nitrogen mass is used instead of the total plant mass. This new result can be

Figure 06 Plant Mass
[view large image]

explained by the theory if the metabolic rate of plants R is proportional to L4 by including the internal dimension as another metabolic site, so that R M. With the older theory, which gives the 2/3 power law, R L3 would be sufficient to yield the same result.
A 2008 research indicates that most organisms' metabolisms are clustered between 1 and 10 watts per kgm of mass. It seems that an optimum metabolic rate is located within this range. Mathematically, this finding is consistent with the R M law because it implies a constant derivative dR/dM 5x10⁻³ watts/gm. Whereas the R M3/4 law would yield a mass dependent derivative dR/dM M-1/4.

§Since Period = 1 / Rate L, this relation shows that the pumping cycle takes longer for organism with larger size.
It is known that all organisms expire after 1 - 2 billion heartbeats, i.e., the life span t x (heart beat rate) = constant or
t 1 / (heart beat rate) L. For example, if we assume 2 billion heartbeats in the lifetime of an average human with 60 heart beats per minute, then t = 64 years.