
| Home Page | Overview | Site Map | Index | Appendix | Illustration | About | Contact | Update | FAQ |
|
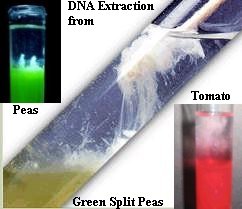
DNA is a long and thin macromolecule with length up to 2 meters but only 10-7 cm in width. It is invisible to the naked eyes. However, the atomic force microscope (AFM) has been used since the mid 1980s to produce topographic maps of nanostructures including DNA. In atomic force microscopy, an extremely sharp tip senses the atomic shape of a sample while a computer records the path of the tip and slowly builds up a three-dimensional image. One of the first images of DNA is shown in Figure 01, where the white blobs are repairing proteins bound to the DNA. There is a crude method to extract DNA from the cells. The result doesn't show the individual macromolecule but appears in the form of cloudy substance. The steps, which are applicable at home and in school, are outlined in the following: |
Figure 01 DNA Image |
 |
|
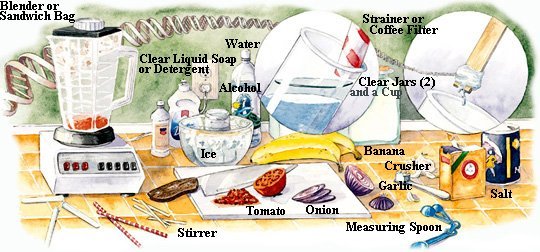
Figure 02 The Prop |
 |
|
Figure 03 DNA Extraction |
See "DNA Organization" for its various natural forms in living cells. |
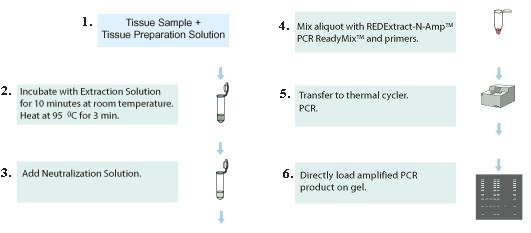 |
1. Add tissue sample into the preparation solution to break the cells apart. 2. Use the extraction solution to break up the cell walls. 3. Add neutralization solution to remove impurities, which inhibit the following actions. 4. Mix primers in the solution to prepare for DNA copying (amplification). |
Figure 04 Extraction Kit |
5. Run the cloning process called PCR (Polymerase Chain Reaction). 6. Load the end product to the gel for DNA analysis. |
 |
1. Agarose powder is mixed with electrophoresis buffer (for establishing pH level, and providing ions to support conductivity, usually Tris-acetate-EDTA (TAE) or Tris-borate-EDTA (TBE)) to the desired concentration, then heated in a microwave oven until completely melted. Most commonly, ethidium bromide (a fluorescent dye that intercalates between bases of nucleic acids and allows very convenient detection of DNA fragments in gels) is added to the gel at this point. After cooling the solution to about 60C, it is poured into a casting tray containing a sample comb and allowed to solidify at room temperature. The insert in Figure 05 shows the effect of agarose concentration on the migration of DNA with 7% resolves longer piece better while the 1.5% is good for the shorter one. |
Figure 05 Gel Electrophoresis |
 |
 |
The Maxam-Gilbert method of DNA sequencing separates the DNA sample into four groups each one treated with a specific restriction enzyme for A, T, G, or C. After this, all four groups are placed in the same apparatus for gel electrophoresis. The resulting DNA sequence is shown in Figure 06a. The process can be automated by attaching different fluorescent dye to the end of the DNA fragments in each group and read off by a scanning detector hooking up to a computer (Figure 06b). This technique can be used to sequence fragments |
Figure 06a Restriction Enzyme |
Figure 06b Automation [view large image] |
of DNA up to many hundreds of units. It has since been refined to perfection by the Sanger's method. |
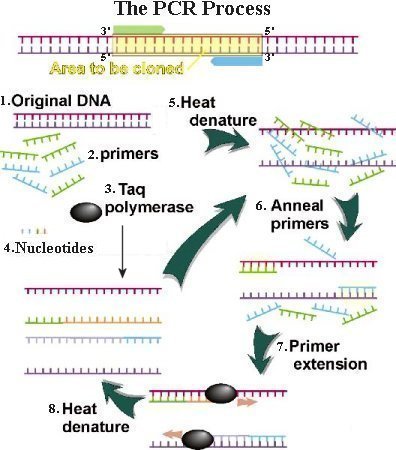 |
3. Modern technique uses the Taq polymerase (from a microbe in hot springs) to add nucleotide to the new strand. It has the advantage of tolerance to heating up to 94oC - well beyond the 72oC for the extension phase. 4. All four DNA nucleotide building blocks are added in sufficient quantity. 5. The sample is heated to a temperature of up to 98oC to separate the complementary strands. This step is called denaturation. 6. Then the sample is cooled. During the cooling stage, the synthetic primers found complementary sites on the separated DNA strands, whereas the two long DNA strands were unable to find each other because they were present in minute concentration. This process is called primer annealing. 7. The polymerase extended the two primers in opposite directions. As a result, two daughter DNA appeared. 8. Initially, the new DNA carries long single-stranded tail. Only at the 3rd cycle of denaturation-annealing-extension do first authentic copy of the molecules appear. The process can make billion copies by the 30th cycle. |
Figure 07 PCR Process |
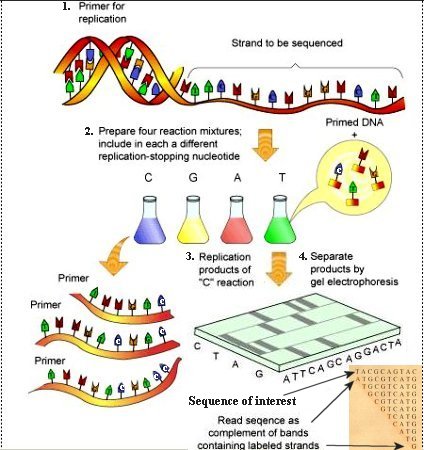 |
1. Primer together with DNA polymerase and nucleotides are added to the sample. The steps proceed similarly to the PCR process up to the extension phase. 2. Just as in the Maxam-Gilbert method, the sample is divided into four groups. 3. The novalty of this method involves molecules called dideoxynucleoside triphosphates (ddNTPs), which are similar to the normal nucleotides except that the oxygen atom is missing in the 3' spot of the deoxyribose. They are designated as ddTTP, ddATP, ddCTP, and ddGTP corresponding respectively to T, A, C, and G. The absence of the oxygen atom terminates the primer extension reaction when the normal nucleotides are replaced by the ddNTPs. In addition, each of the ddNTPs emits a different fluorescent signal to identify the T, A, C, G bases. 4. The sample is processed by gel electrophoresis as usual revealing the DNA complementary sequence by the end label of each fragment as shown in Figure 08a. |
Figure 08a DNA Sequencing |
 |
Another single molecule sequencing technique is to keep the concentration of one of the four nucleotides required for transcription extremely low, pausing events will occur as the RNAp attempts to add this nucleotide to the growing chain. Holding each of the four nucleotides at the rate-limiting concentrations in four otherwise iden-tical assays, it shows that the process is able to sequence the underlying DNA up to 32 base pairs by analyzing the ordered sequence of pausing in each of the 4 cases. |
Figure 08b Single DNA Sequencing [view large image] |
An example of their transcription data is shown on the top of Figure 08b, which plots the position vs time for each of the nucleotide in low concentration (the hori-zontal step pinpoints the position). The inferred sequence is shown in the bottom. |
 |
Large-scale sequencing aims at sequencing very long DNA fragments. Even relatively small bacterial genomes contain millions of nucleotides, and the human chromosome 1 alone contains about 246 million bases. Therefore, some approaches consist of cutting (with restriction enzymes) or shearing (with mechanical forces) large DNA fragments into shorter DNA fragments. The fragmented DNA is cloned into a DNA vector, usually a bacterial plasmid, and amplified in Escherichia coli as the bacteria divides. These steps are shown in Figure 09. |
Figure 09 Large Scale Sequencing [view large image] |
 |
1. The source DNA is mapped with some known genetic markers (landmark). 2. It is cut into smaller pieces called sub-clones according to the genetic markers. This allows the sub-clones to be placed in an order based on the structure of the DNA. 3. The sub-clones are further divided into fragments. 4. The fragments are then sequenced and matched at the overlaps. 5. The sequenced sub-clones are linked up (according to the order) to produce the DNA contig, which is the de-coded version of the original source DNA. As this method progresses, larger and larger contigs will be produced, until a single ordered contig of the genome is achieved. This method saves labour by allowing sequencing of each individual clone in different laboratories and |
Figure 10 Hierarchical Shotgun [view large image] |
that each stretch of DNA only needs to be sequenced once. The disadvantage is the slow process of sub-cloning and mapping of the source clones, requiring significant human manipulation. |
 |
the same way as shown in Figure 09. There is no physical genetic map to order the fragments. Instead, each fragment is sequenced first, and then overlapping sequences are joined together to create the contig. In other words, random fragments are sequenced (as they are not ordered) in the hopes that overlapping sequences will be found to piece together the contiguous sequence. To ensure that that the whole source clone has been sequenced, this stretch of DNA must be sequenced numerous times (represented by the multiple rows of fragments in Figure 11) to produce an ordered overlapping sequence. Gaps in this process will occur where no fragment is found. This method is advantageous in that the laborious process of mapping and sub-cloning is eliminated. So, while it requires much more sequencing compared to the Hierarchical Shotgun, it proves to be much more economical and faster due to the sequencing reactions being virtually fully automated and the sequences being assembled by computer programs. |
Figure 11 Shotgun Sequencing [view large image] |
 |
1. Single strand DNA fragments (of unknown identity) with fluorescent tags are poured into the apparatus. 2. Short DNA fragments of known sequence are already immobilized on the microchip (about 1cm x 1 cm). The known sequence in the example consists of 6 bases each resulting in 46 = 4096 different combinations. The known sequence are arranged in a vertical column contrary to the illustration in the diagram. 3. The fluorescent labels reveal 6 complementary bases of the unknown sequence as it is aligned with one of the column. |
Figure 12 Hybridization |
4. The entire sequence can be derived from the overlaps. 5. The unknown is just the complementary of the above. |
 |
 |
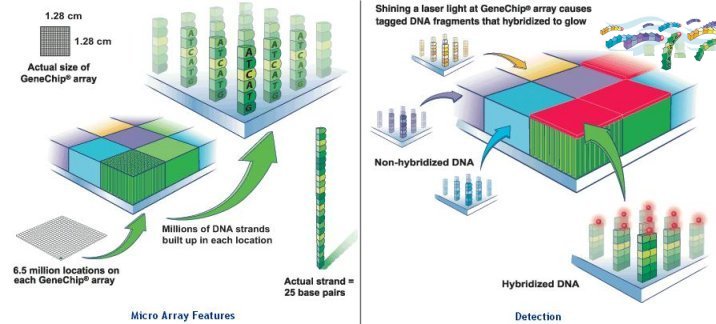
millions of identical DNA strands in each location, and each strand consists of 25 bases (called probes). The array is rinsed and washed with a fluorescent stain that clings to the biotin on the strands of the human sample that remain. A laser causes them to glow, and the DNA is analyzed based on which probes on the array they matched with. The latest offer by Roche claims to capture up to 5 Mb of total |
Figure 13 Affymetrix Micro Array [view large image] |
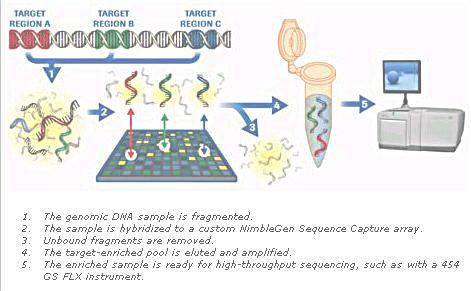
Figure 14 Roche Micro Array [view large image] |
sequence on a single array (see Figure 14). |
 |
 |
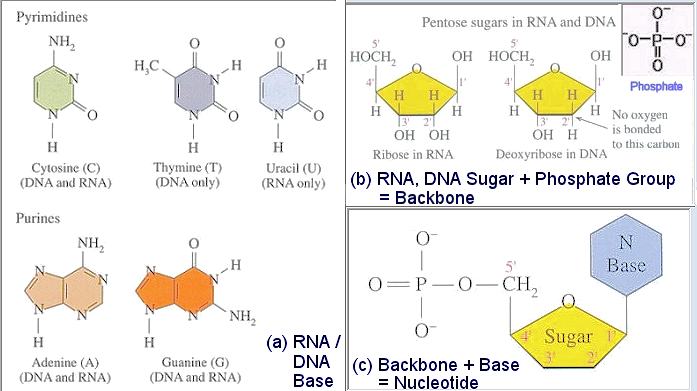
It is the bases that provide the codes for the representation. The four bases are the two purines (with 2 rings) cytosine (C), thymine (T), and two pyrimirines (with 1 ring) guanine (G), adenine (A). The G always couples to C, and similarly for T and A in the complimentary pair of the DNA (Figure 16). One coding scheme uses G, C to represent bit 0, and T, A for bit 1. This method often leads to long string of the same base called homopolymer, which contains no information. |
Figure 15 Base, Backbone, and Nucleotide [view large image] |
Figure 16 DNA |
Other kind of translation to avoid this problem is possible (see Conversion). |
 |
 |
|
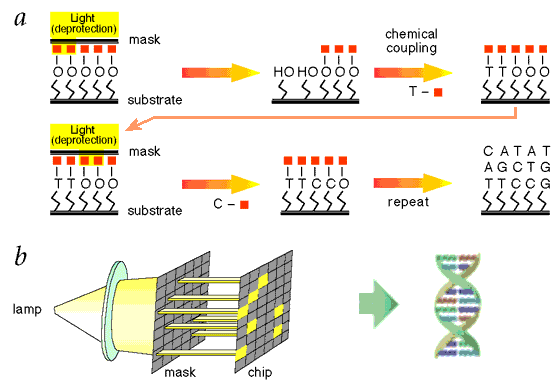
Figure 17 Oligonucleotide Synthesis [view large image] |
Figure 18 Synthesis Process [view large image] |
|
 |
|
Figure 19 Digital DNA |
 |
|
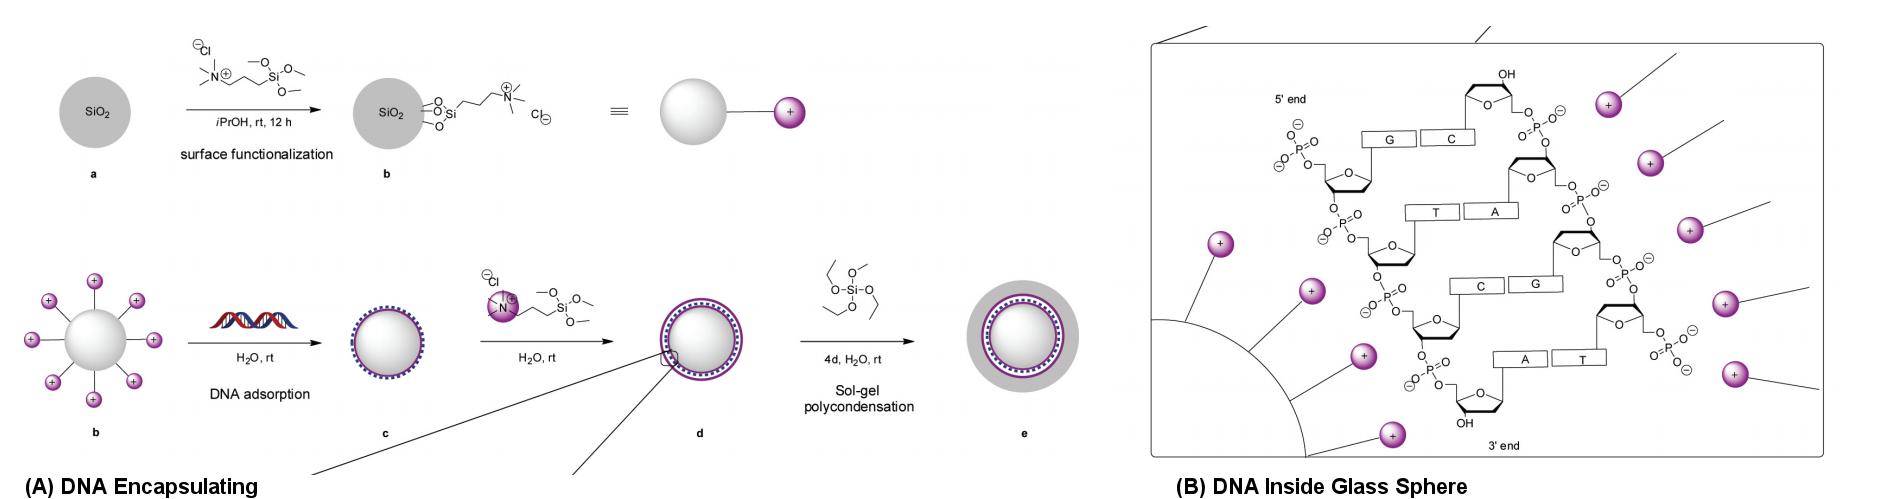
Figure 20 DNA Encapsulation in Glass Sphere [view large image] |
|
 |
 |
|
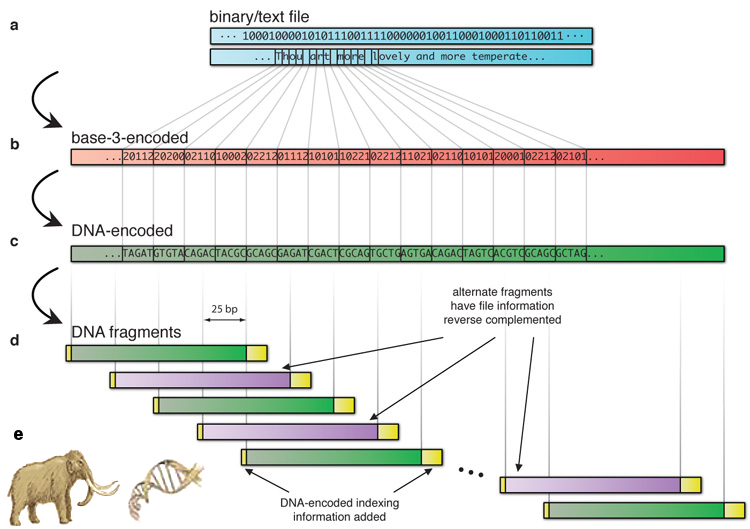
Figure 21 [view large image] Data in Oligonucleotides |
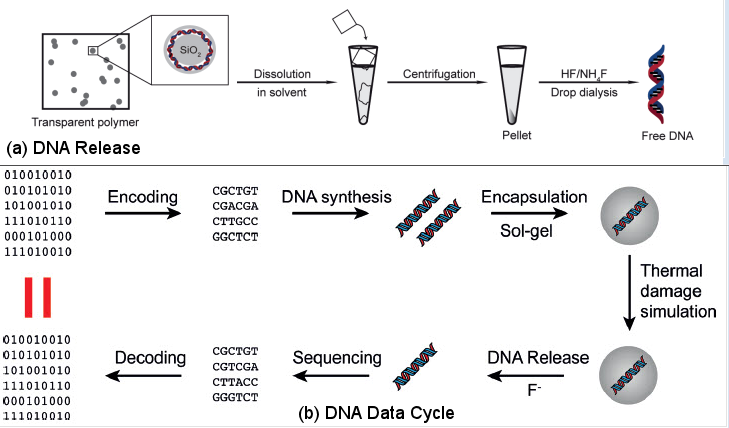
Figure 22 DNA Data Cycle |
 |
|
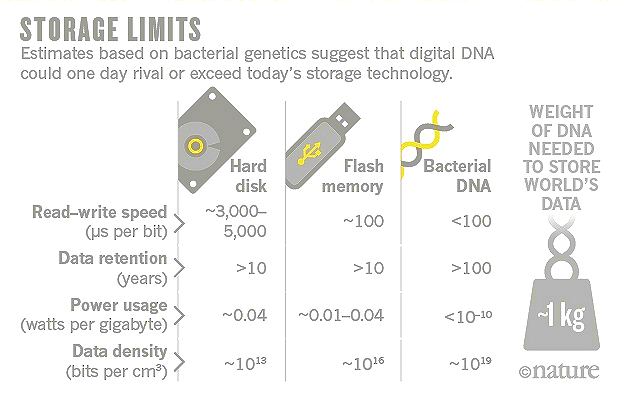
Figure 23 Data Storages |
See the latest (2016) research in "How DNA Could Store All the World's Data". |