 |
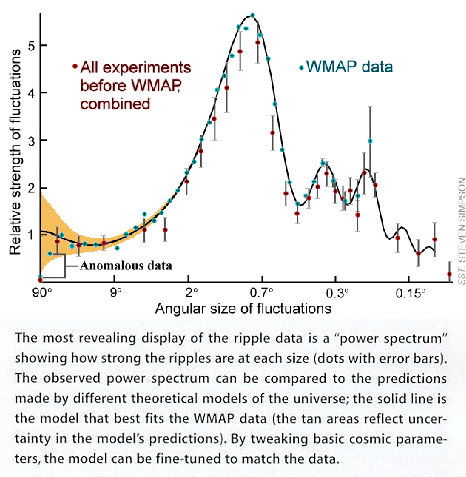
Theoretical physicists use the power spectrum plot to determine the cosmological parameters by the observational data. Essentially, the power spectrum is a plot of the amount of fluctuation against the angular (or linear) size. The fluctuation is the difference in the two measurements at the corresponding points. It can be the fluctuation of temperature or density or any other kind of measurable quantity. Figure 02-08 shows just one example with the WMAP observational data superimposed on a theoretical curve. The theoretical curve varies with several parameters such as the total cosmic density, the baryon density (luminous matter) and the Hubble's constant. The best fit model is the lambda cold dark matter model with an initial inflation, a period of galaxies formation induced by cold dark matter, and then the speedup of the cosmic expansion. However, none of the theoretical models based on inflation can account for the anomalous data in Figure 02-08 at large angular size. Double checking the instruments and analysing procedures also fails to explain the anomalies. More observations are needed to resolve the puzzle. |