

| Home Page | Overview | Site Map | Index | Appendix | Illustration | Preface | Contact | Update | FAQ |
|
|
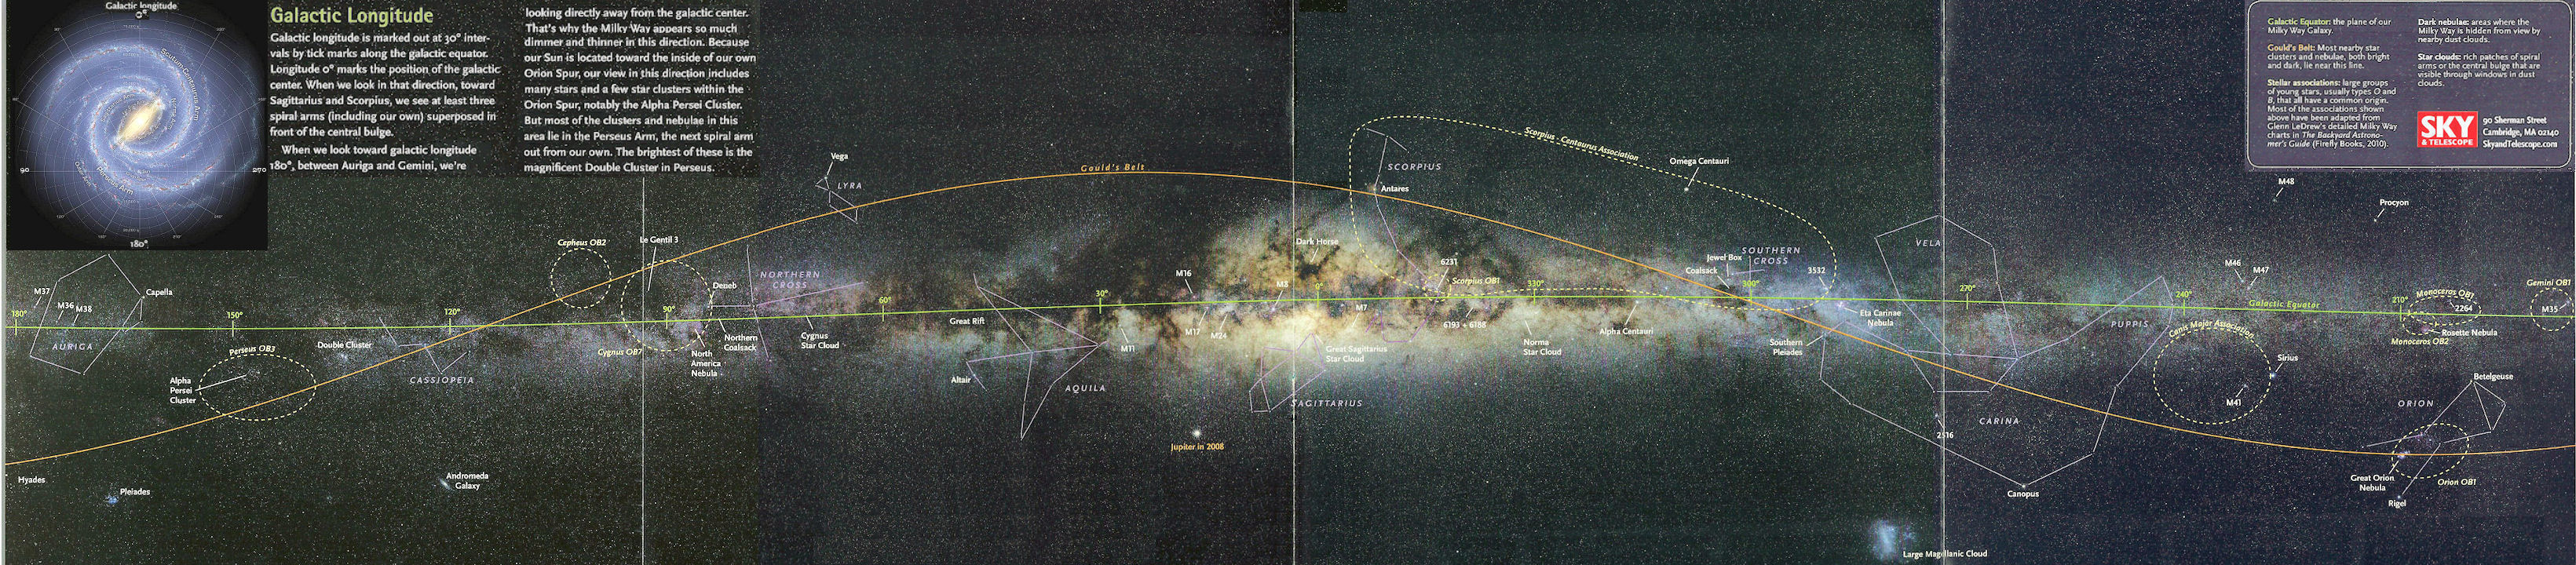
There are about 4x10¹⁰ galaxies in the universe. Among this multitude of galaxies, 34% are spirals, 20% are ellipticals, and 54% are irregular. We happen to live in an ordinary spiral galaxy called the Milky Way. On a clear night and with the aid of long exposure time, it appears like a silvery river across the sky as shown in Figure 05-11. It is a view looking from inside the galactic disk. The all sky view in different regions of the electromagnetic spectrum is shown in Figure 05-12 (in false colours). Figure 05-13a shows the Milky Way in panorama and top views. |
Figure 05-11 View from Death Valley [view large image] |
Figure 05-12 All Sky View |
 |
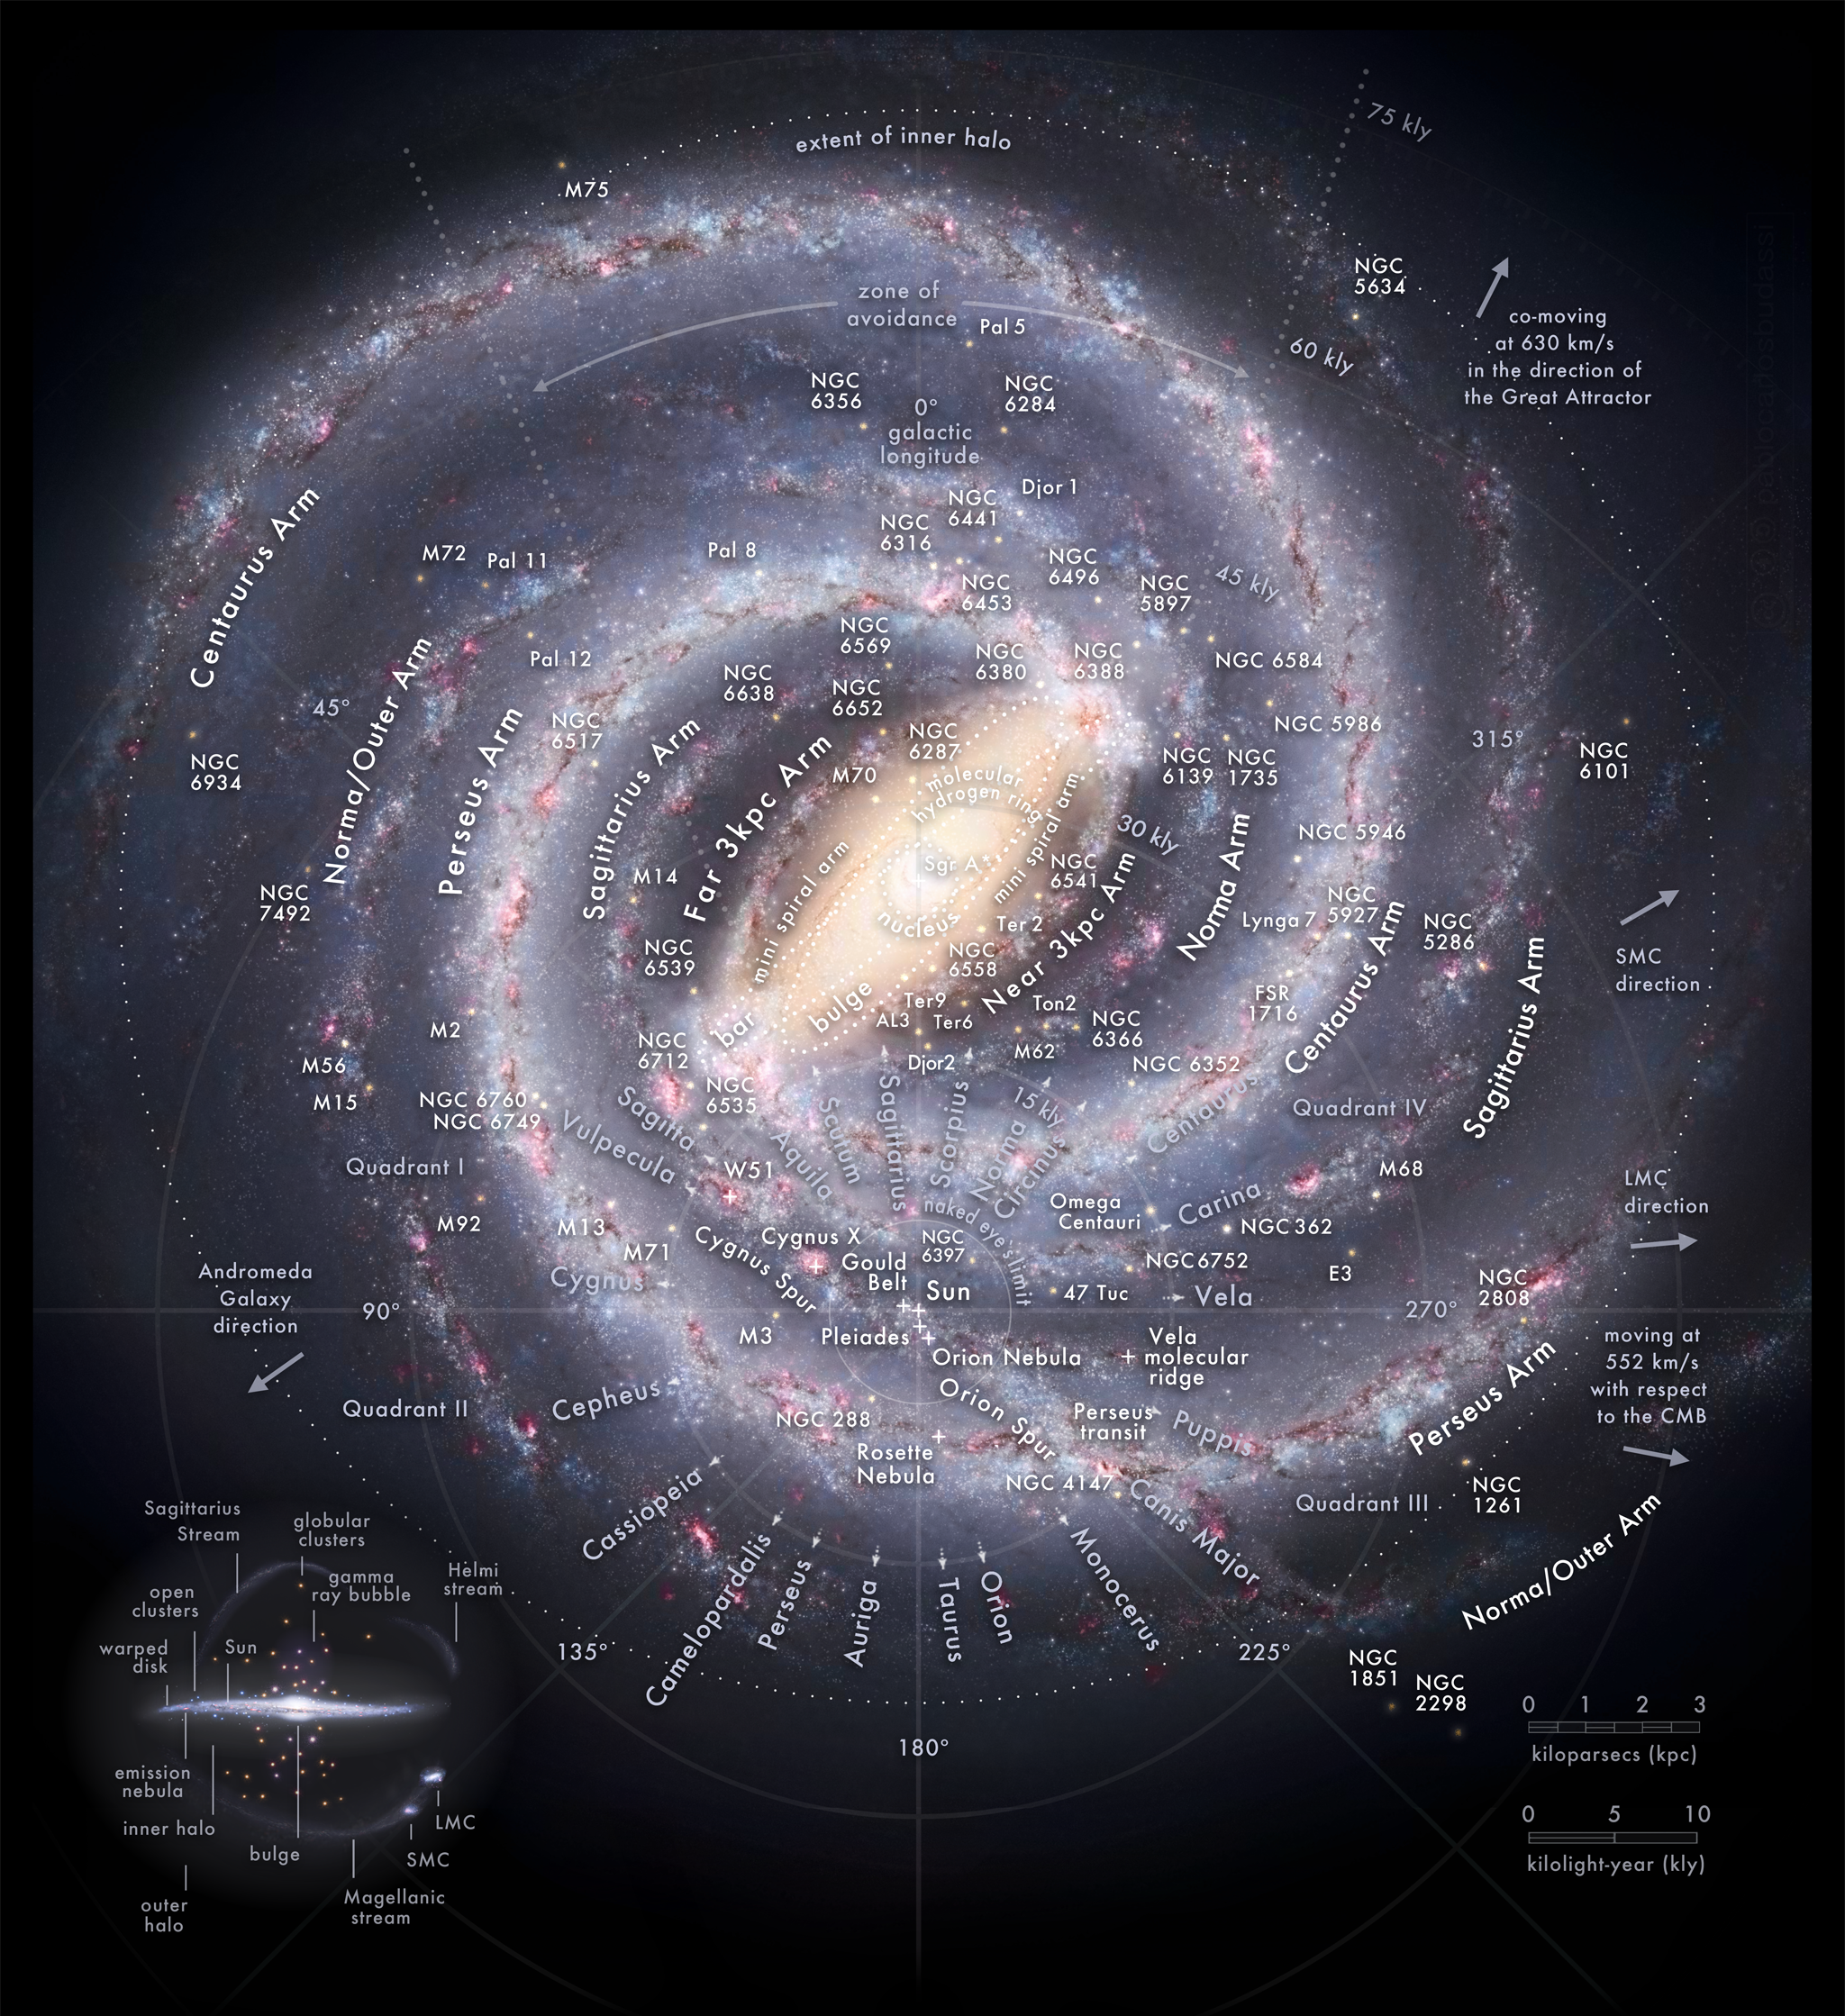 |
Figure 13a Parnorama View of the Milky Way [view large image] |
Top View |
 |
 |
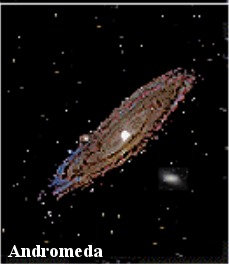
If we could fly away from the Milkyway and look back, the view would be similar to the spiral galaxy NGC 7331 as depicted in Figure 05-13b. Similar in size to our own Milky Way, spiral galaxy NGC 7331 lies about 50 million light-years away toward the constellation Pegasus. It contains a mixture of young stars in the bluer regions and an older population in the yellowish center. The total mass of NGC 7331 and the Milky Way is estimated to be 1.5x10¹² solar mass. The first painting featuring a prominent MilkyWay is probably the "Flight into Egypt" of |
Figure 05-13b NGC7331 [view large image] |
Figure 05-13c Milkyway, Artist's View [view large image] |
the holy family by Adam Elsheimer in 1609 (Figure 05-13c). In the Middle Ages, it is called the "Jacob's Ladder" leading to heaven in his dream. It is also known as "Silvery River" in other folklore. |
 |
 |
up to 10 million solar mass and 10,000 ly across, moving rapidly (from 90 to 400 km/sec) through the outer regions of the galaxy. These materials form the reservoir from which the Milky Way can draw on to make new stars. An August 2008 report from the Sloan Digital Sky Survey indicates that there are many stellar streams crisscrossing the Milky Way halo. They are the stars torn from disrupted satellite galaxies that have merged with the Milky Way. Figure 05-15a is a theoretical model of a galaxy like the Milky Way showing many trails of stars . The region shown is about 1 million light-years on a side; the Sun is just 25,000 light-years from the center of the galaxy and would appear close to the center of this picture. |
Figure 05-14 Milky Way Neighborhood [large image] |
Figure 05-15a Milky Way Streams [view large image] |
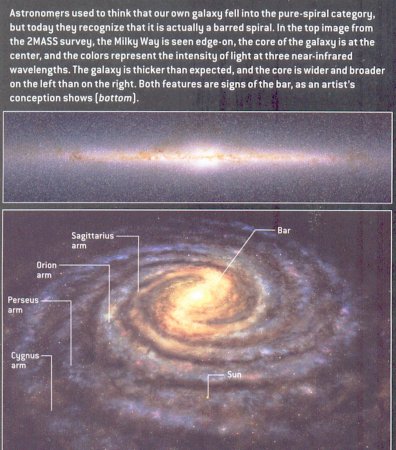 |
The disk of the Milky Way exhibits a spiral structure, which shows up in the distribution of objects populating the disk component. These objects include, the HI regions of neutral hydrogen atoms, the population I objects such as young stars, diffuse star-forming nebulae, H II regions of ionized hydrogen atoms and open star clusters. These population I objects are very young, in contrast to the very old population II objects in the Milky Way's Halo (globular clusters and old stars, including older planetary nebulae). The arms of the Milky Way, at least near the solar neighborhood in our Galaxy, are typically named for the constellations where more prominent parts of them are situated. The solar system is trundleing around at nearly 200 km/sec in the Local or Orion Arm - a spur in between the more substantial Sagittarius and Perseus arms. The Milky Way is now known as a barred spiral. The evidence, at first indirect, began to accumulate in 1975: stars and gas tracked in the middle of the Milky Way did not follow the orbits they would if the spiral pattern reached all the way in. Recent surveys of the sky in near-infrared |
Figure 05-15b Barred Milky Way |
light have revealed the bar directly and dispelled the remaining doubts (Figure 05-15b). |
 |
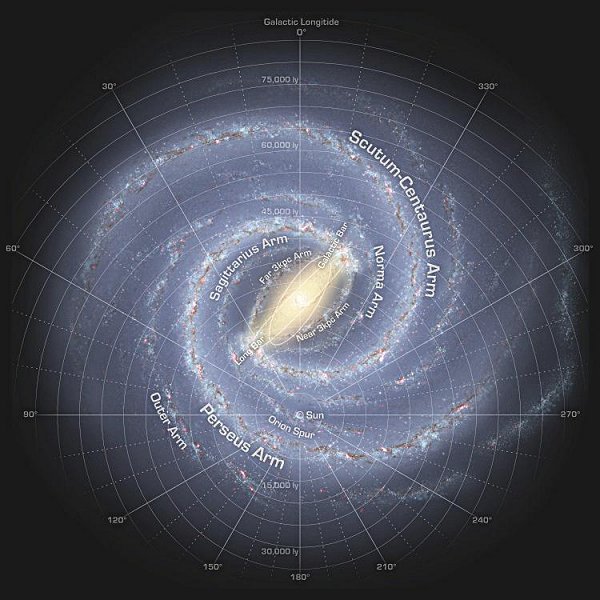 |
forming regions, along with reddish emission from graphite dust particles. Blue specks throughout the picture are individual Milky Way stars. The new data also reveal a structure different from the traditional view. It finds that the Milky Way is a barred spiral with only two major arms - the Scutum-Centaurus and Perseus arms. They contain the greatest densities of both young, bright stars, and older, so-called red-giant stars. The two minor arms, Sagittarius and Norma, are filled with gas and pockets of young stars. The solar system lies near a small, |
Figure 05-15c Milky Way, |
Figure 05-15d Latest Version [large image] |
partial arm called the Orion Arm, or Spur (see an artist's rendition in Figure 05-15d). While most of the arms are spiraling inward to the center, the 3 kpc arms are expanding at speed more than 50 km/sec. |
 |
Top View : 1. Galactic Center - A super-massive black hole of 4 million solar mass is sitting at the center. It is about 8 kpc from Earth. 2. Galactic Bar - It is a region about 8.6 kpc long, where stars orbit in narrow elliptical instead of circular paths. 3. Central Molecular Zone - This zone contains dense, turbulent gas that gives rise to new stars at a higher rate than more outlying regions. It is about 7.4 kpc across. 4. Spiral Arm - When orbiting stars and gas enter the arms, they slow down and bunch up triggering star birth. 5. Gas Flow - The gas entering a spiral arm deflects slightly toward the galactic center, where it fuels star birth. 6. Spiral Flow - The movement of gas, dust, and stars forms a spiral pattern, which indicates a "sink" (the black hole) at the galactic center. |
Figure 05-16a |
Side View : |
 |
 |
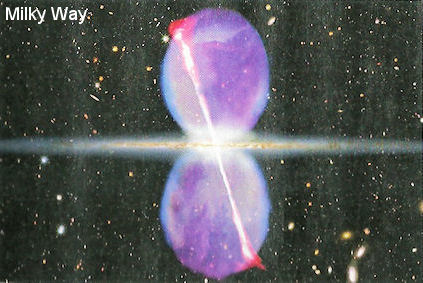
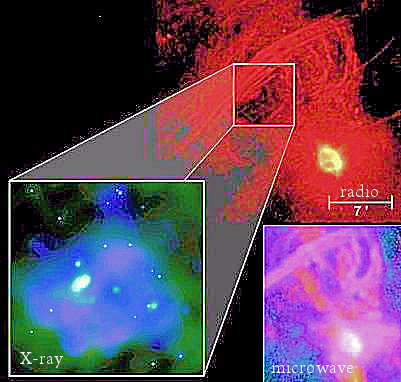
12. Bubbles and Beams - It was discovered by NASA's Fermi Gamma-ray Space Telescope in 2010 that there are pairs of gamma-ray bubbles and beams emanating up and down from the Milky Ways's center out to a distance of 27000 light-years (Figure 05-16b, by artist's impression). These features indicate that the Milky Way was much more active not long ago. The beams likely resulted from hot matter squeezing through the magnetic field in the galactic center while the bubbles probably formed from the push of material spewing from the central black hole. The structure is strikingly |
Figure 05-16b Bubbles and Beams from Milky Way Center [view large image] |
Figure 05-16c Active Galaxy Centaurus A |
similar to the active radio galaxy Centaurus A as shown in Figure 05-16c (the real thing in various wavelengths, not a rendition by an artist). Even the tilt of the jets at 15o to the rotational axis appears to be the same. |
 |
 |
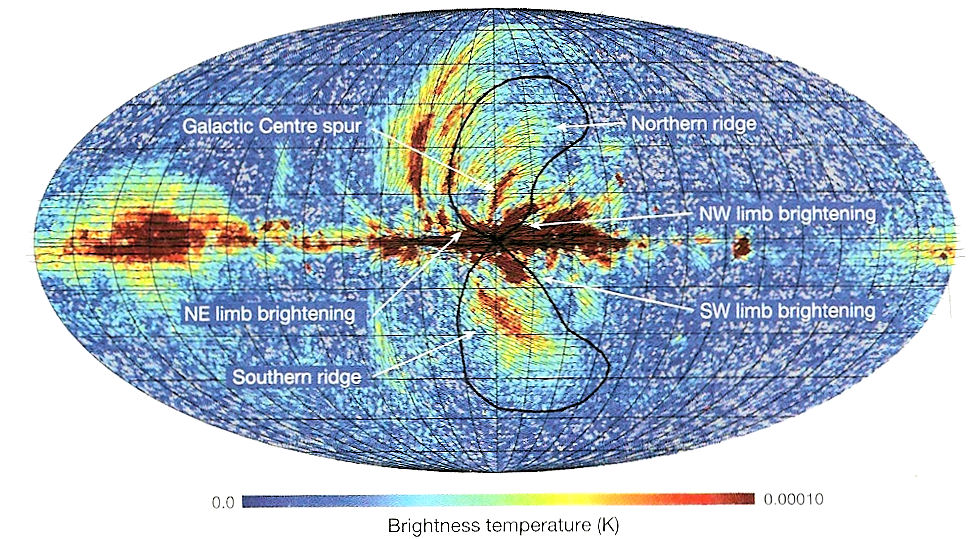
The real image of the Milky Way bubbles in radio frequency finally appears in an early 2013 issue of Nature. It is taken at 23 GHz showing at least three ridges. The lobes (black solid line) are permeated by strong magnetic fields of up to 15 µG. The field lines (light dark curves) is aligned with the ridges following the curved shape(Figure 05-16d1). The study concludes that the radio lobes are formed by star formation (rather than black hole driven) with outflow from the Milky Way's central 200 pc. The process transports a huge amount of |
Figure 05-16d1 MW Bubbles in Radio Frequency |
Figure 05-16d2 Milky Way Bubbles |
magnetic energy, about 1055 ergs (~ 10 Msun), into the galactic halo. Figure 05-16d2 is a 2013 interpretation of the bubbles in terms of winds of hot gas from young star clusters. See "X-Ray Surveys of the Galactic Black Hole, 2019". |
 |
|
Figure 05-16e1 SKA [view large image] |
 :
:
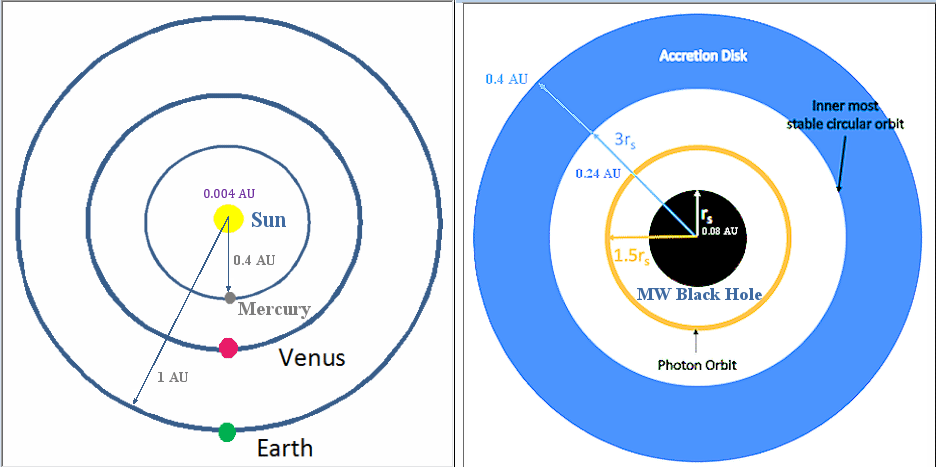 |
The distance from the Sun to the nearest star - Alpha Centauri, is 1.34 pc.  1 pc = 3x1018 cm. 1 ly = 1018 cm = (1/3) pc. At Milky Way center, 1o  144 pc (measured from the Sun at a distance of ~ 8 kpc). 144 pc (measured from the Sun at a distance of ~ 8 kpc).Sun-Earth distance = 1 AU = 5x10⁻⁶ pc = 1.5x1013 cm. Inner radius of accretion disk ~ 0.24 AU = 1.2x10⁻⁶ pc (~ distance from Sun to Mercury). Schwarzschild radius for the Milky Way black hole rs = 0.08 AU = 4x10⁻⁷ pc. |
Figure 05-16e2 Milky Way Black Hole, Explained |
See Figure 05-16e2 for a comparison of the orbital size between the inner solar system and the inner region of the Milky Way Black Hole; and the "M87 Black Hole" which is about 1.55x10³ times larger both in mass and rs. |
 .
. |
|
Figure 05-16e3 Milky Way Center [view large image] |
filaments are magnetized (although about 1000 times weaker than the Earth's), they are amplified along the filaments amid a weaker magnetic field permeating the central 100 pc, a primary characteristic all the filaments share (see details in "Galactic Center Filaments"). |
 |
|
Figure 05-16e4 CMZ (Central Molecular Zone) |
higher than in the Galactic disk.
|
 = d[logF(
 )] / d[log()] or F() = ,
where F() is the flux density = rate of flow of the radiation per unit area per unit frequency . is related to higher flux density from the source.
)] / d[log()] or F() = ,
where F() is the flux density = rate of flow of the radiation per unit area per unit frequency . is related to higher flux density from the source.
 |
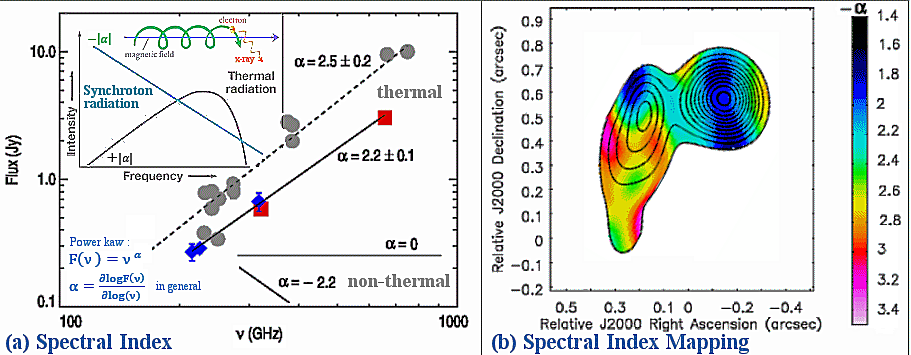 |
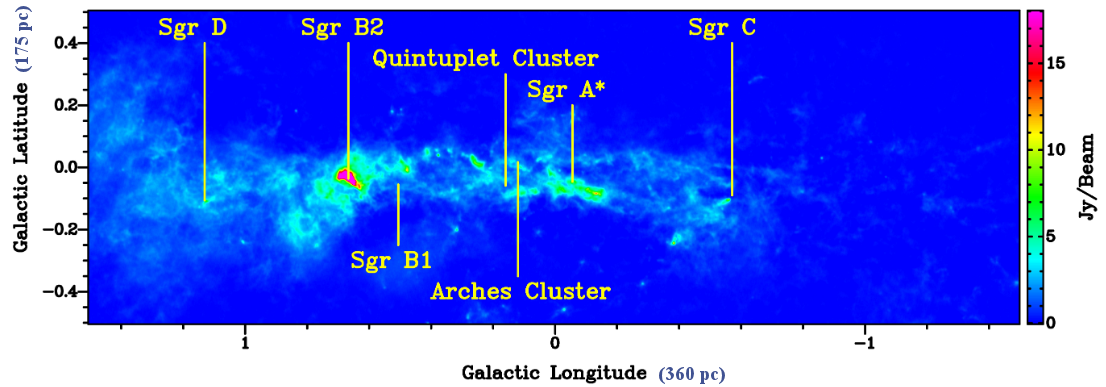
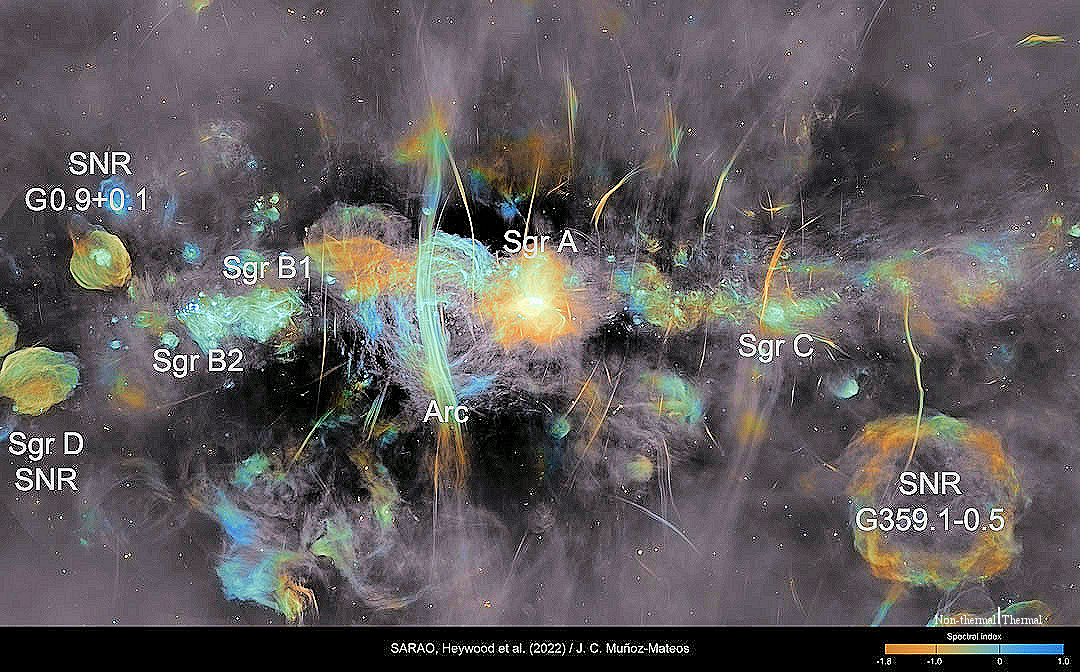
For example, the region in blue associates with higher flux density in Figure 05-16e6,b. While in Figure 05-16e5, objects in red to light-green colors have negative from synchrotron radiation (showing the magnetic field lines as well); These objects would fade away in high frequency such as the infrared (Figure 05-16e4).
|
Figure 05-16e5 Milky Way Center, Re-visit |
Figure 05-16e6 Spectral Index |
In Figure 05-16e5, objects with deep-green to blue color having positive are thermal emission from molecular clouds (associated with Sgr A, B, C, D, and dust).
|
 |
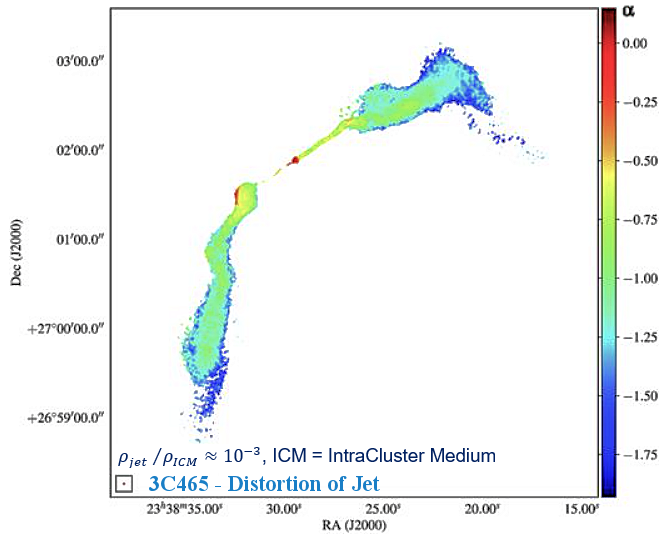 |
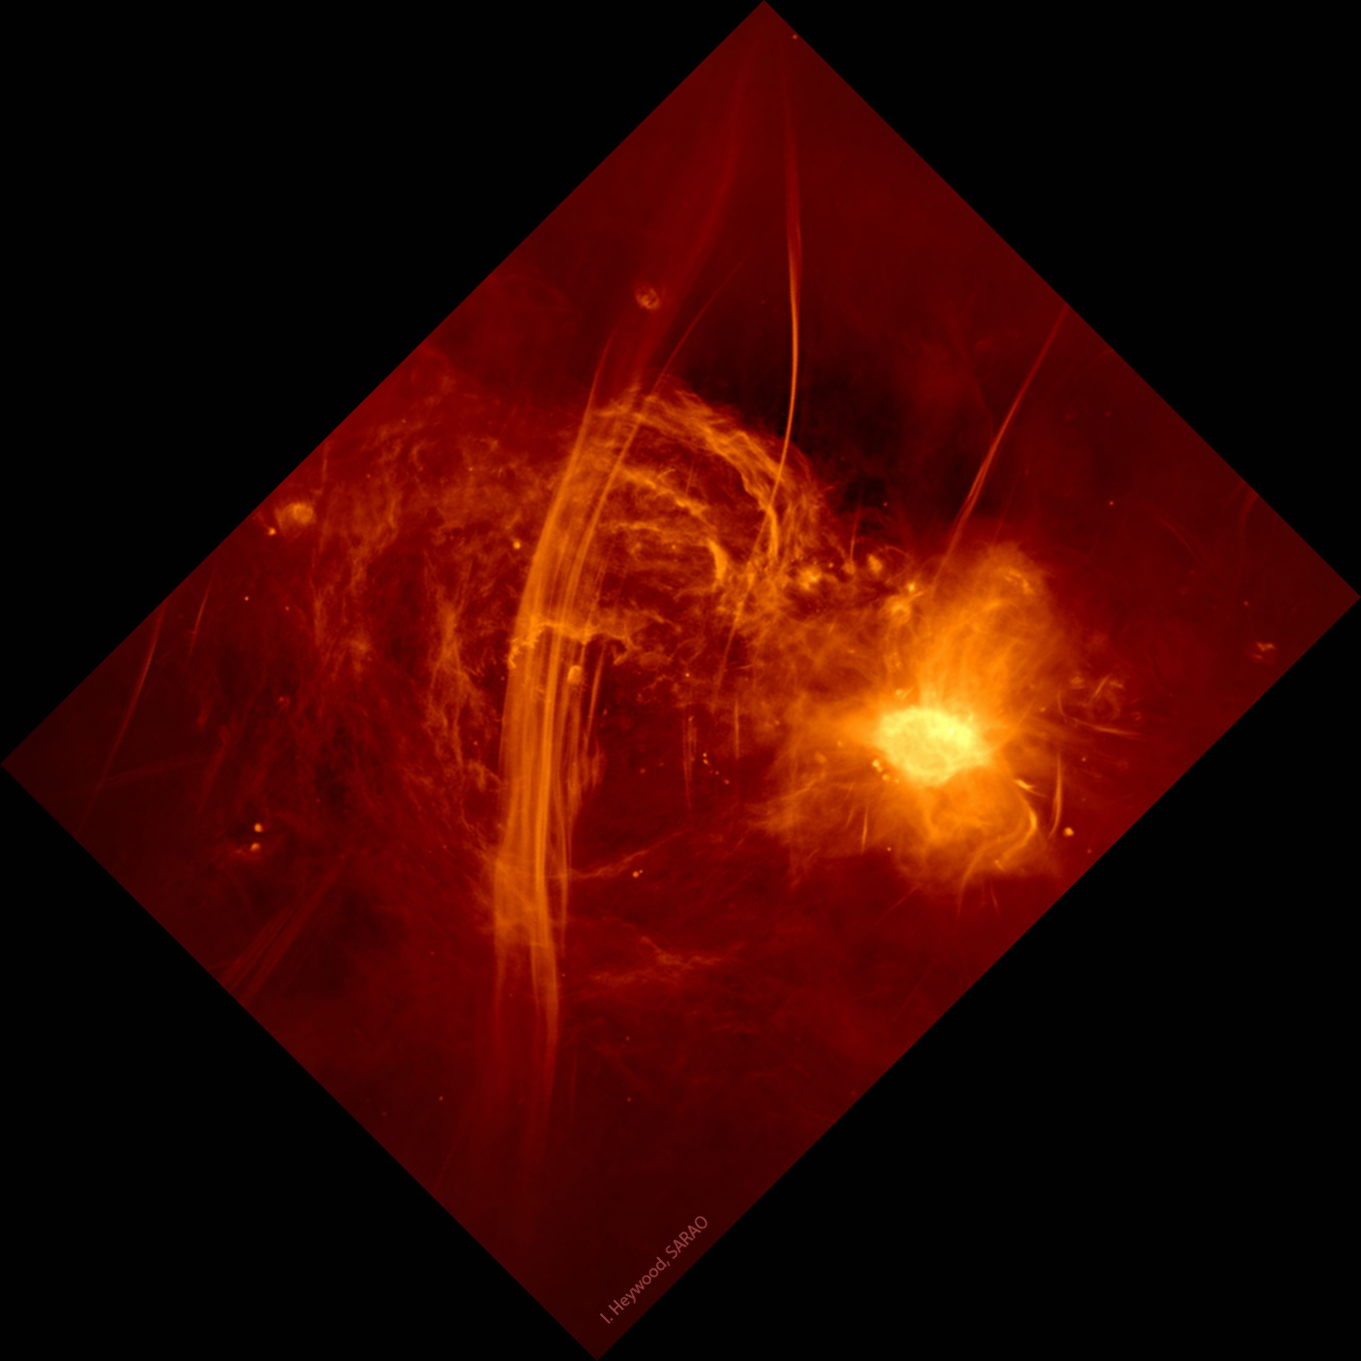
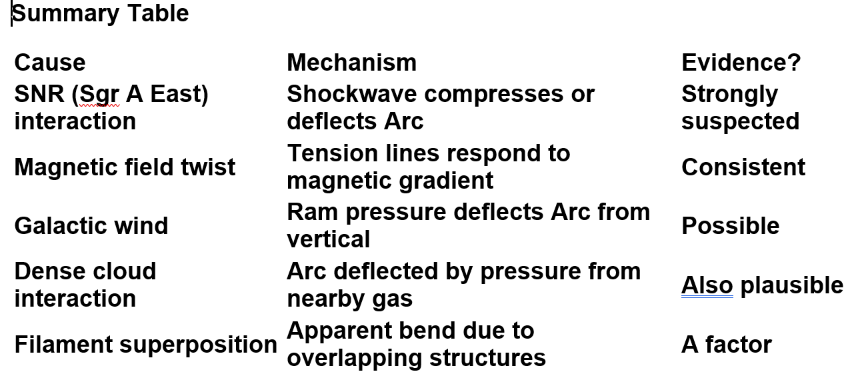
Origin of the radio arc in Figure 05-16e5 (see also its enlargement in Figure 05-16e7) is still not well understood. It is a subject of active research and debate among astronomers. Large-scale supernova explosion, and multiple outbursts from Sgr A* over several thousand years ago have been suggested. However, comparison with the case of distorted jets in 3C465 (see Figure 05-16e8, and "A high-resolution view of the jets in 3C 465") indicates that the arc could be the result of interaction with the surrounding medium such as dense molecular cloud. |
Figure 05-16e7 Radio Arc, Milky Way Center |
Figure 05-16e8 [view large image] |
(see "X-ray Gas Associated with the Galactic Center Radio Arc"). The bent jet and its synchrotron radiation have betrayed the secret of its origin (see a video on "Bent Jets from Black Holes"). |
 |
 |
Figure 05-16ea shows the PA with respect to Galactic north (PA = 0�), traced by different colors. It displays the full range of filament between 0� and 180�. The colors are used in order to distinguish between the filaments with positive PA (red) and negative PA (blue). The distribution suggests that the filaments oriented perpendicular to the Galactic plane tend to be long. On the other hand, filaments with PAs running parallel to the Galactic plane are short in yellow color. |
Figure 05-16e9 PA Definition |
Figure 05-16ea Filament PA [view large image] |
 |
The majority of short filaments have positive spectral indices consistent with thermal emission though it cannot exclude nonthermal filaments similar to the filaments of the Radio Arc near ~0.2o. Figure 05-16eb,b also indicates that some short filaments are nonthermal with a steep negative spectral indices (see Update 2023). |
Figure 05-16eb Filaments, Short [view large image] |
It is noted that vertical filaments dominated by length L > 66" have non-thermal spectra. |
 |
|
Figure 05-16ec Sgr E and Model [view large image] |
|
 |
This research article does not offer an explanation about its origin, but cautions that the standard abundance of CO (XCO = 10-4) and/or the "dust to gas" ratio (10-2) is too low for the Galactic Center environment. Figure 05-16ec2,a shows the location of "The Brick", |
Figure 05-16ec2 The Brick [view large image] |
while 16ec2,b presents its image in Celestial (Equatorial) Coordinates with the origin of the Milky Way center at R.A. 17h 42.4m, Dec. -28o 55'. |
 [view large image]
  ] from "Sgr A* - The Supermassive Black Hole in the Milky Way", and "The episodic and multiscale Galactic Centre" (for the 3-D schematic). line emission, and continuum emission in white contours. The Bondi circle marks the boundary where surrounding medium (gas, dust) is likely to fall in. See "A cool accretion disk around the Galactic Centre black hole".
 )1/2 is less than the escape velocity (see "Magnetohydrodynamics (MHD) and the Formation of Jets"). In addition, the intensity of the Synchrotron radiation also depends on the frequency (see "Synchrotron Radiation", Cosmic Jet, and a video of the M87 Jet).

 |
 |
 See Figure 05-16ed (for no loss of angular momentum L). |
Figure 05-16ed Accretion Disk |
Figure 05-16ee Accretion |
The dark curve in Figure 05-16ee shows the unit mass moving in from infinity crossing the ISCO and continuing the spiral movement into the black hole (in case of angular momentum shredding). |
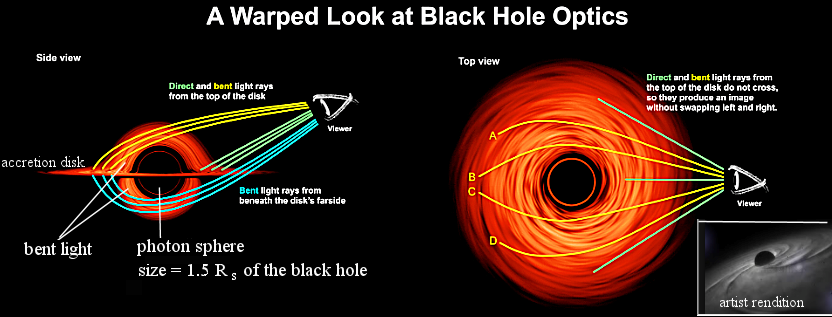 |
Figure 05-16eg is a series of views as the observer moving in an orbit perpendicular to the accretion disk. The greatest distortion occurs for viewing the system edgewise. In the absence of gravity, it is not possible to see the light from the back-half of the accretion disk. In case of a black hole, the extra-strong gravity pulls light from over and under the far side of the accretion disk toward the observer. The effect diminishes gradually to the minimum in the top view (see Figure 05-16ef). |
Figure 05-16ef BH Visualization |
The sequence is shown by many videos in "Black Hole Accretion Disk Visualization", also see : "Visualization: A Black Hole Accretion Disk" by APD - 2024,May. |
 [view large image]


 /dt),/dt). direction (proportional to the Coriolis Force) beside the "Density Wave Theory".
________________________________________
/dt),/dt). direction (proportional to the Coriolis Force) beside the "Density Wave Theory".
________________________________________ ________________________________________
 ________________________________________
 ________________________________________
 ________________________________________
 ________________________________________
  ________________________________________
 , , see angular momentum________________________________________
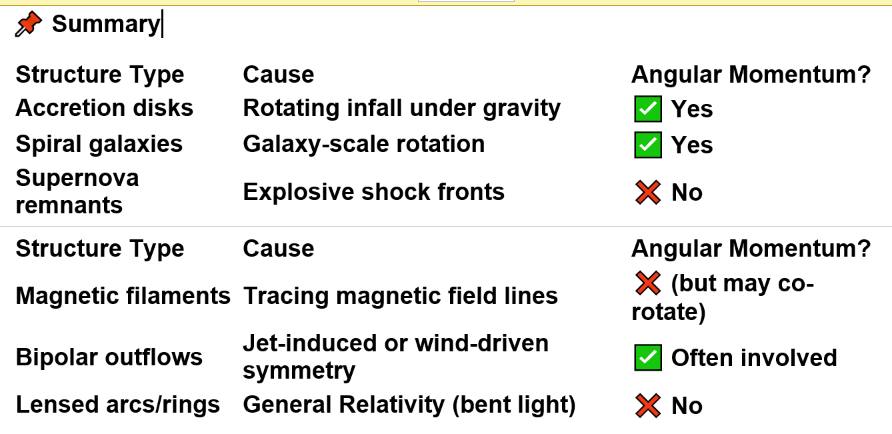