| Home Page | Overview | Site Map | Index | Appendix | Illustration | About | Contact | Update | FAQ |
|
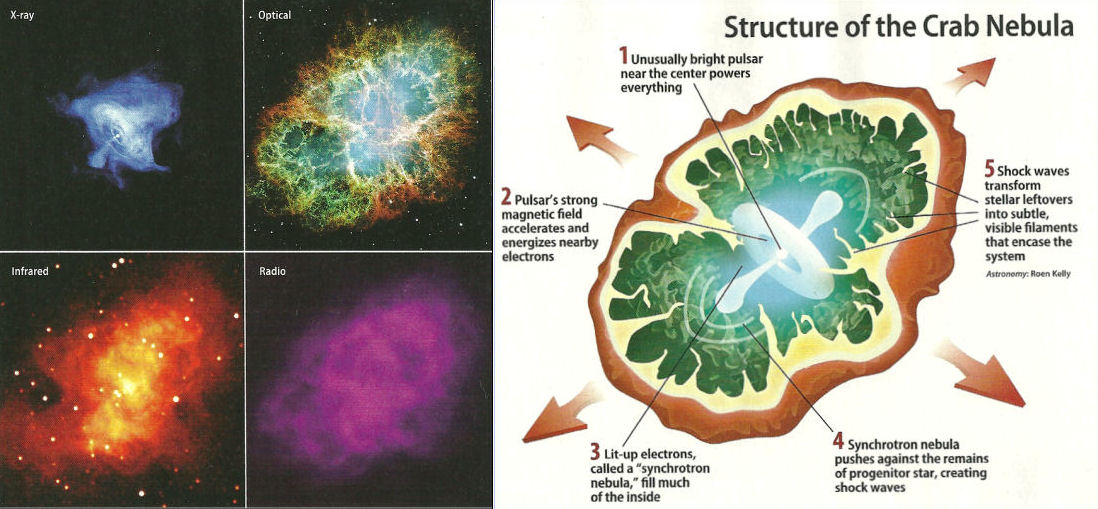
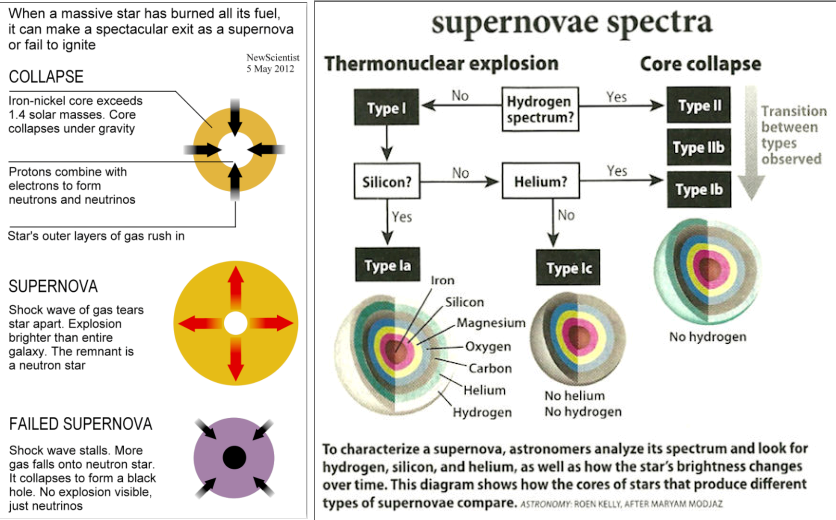
When stars with mass greater than 5 Msun exhaust their nuclear fuel, they collapse suddenly in a process called supernova explosion, which flings off huge amount of heavy elements into interstellar space. Supernovae can be classified into two types. Their characteristics are listed in Table 08-04. Figures 08-13a shows images of the Crab Nebula taken at different wavelengths. The Crab Nebula is a supernova remnant after an explosion at 1054 AD. |
Figure 08-13a Crab Nebula [view large image] |
In the optical image, red colour comes from electron recombination to form neutral hydrogen (producing emission lines), while blue colour is generated by synchrotron radiation. The X-ray image shows an enlarged view of the central region with rings of high-energy particles flinging |
|
 |
||||||||||||||||||||||||||||||
Table 08-04 Types of Supernova |
Figure 08-13b Supernova, and the Spectral Types of [view large image] |
 |
It is known theoretically back in 1966 that during a core-collapse supernova explosion it emits on the order of 1058 neutrinos and antineutrinos in all lepton flavors. The luminosity of different neutrino and anti-neutrino species are roughly the same. They carry away about 99% of the gravitational energy of the dying star as a burst lasting tens of seconds. The typical supernova neutrino energies are 10 to 20 MeV. Supernovae are considered the strongest and most frequent source of cosmic neutrinos in the MeV energy range. In February 1987, the observation of supernova neutrinos from SN 1987A in the Large Magellanic Cloud confirmed the hypothesis (see "Supernova neutrinos", and a pictorial depiction in Figure 08-13c for more info) |
Figure 08-13c SN Neutrinos |
 |
 |
The brightest supernova on record so far (2007) is the SN2006GY (Figure 08-14), which was the dying explosion of a star 150 times the mass of the Sun. In such an exceptionally massive star, it is suspected that an instability (produced by high temperature and pressure) could convert light into matter-antimatter pairs. This would cause a pressure drop, making the star contract and igniting a runaway nuclear reaction to obliterate the stellar core. Thus, unlike other massive star supernovae, neither neutron star, nor black hole, would remain. |
Figure 08-14 SN200GY |
Figure 08-15a GRB080319B [view large image] |
 |
The fading afterglow was captured in both X-rays and Ultraviolet light (Figure 08-15a). The farthest gamma-ray burst (GRB090423) was detected by the Swift Observatory in April 2009. At redshift z = 8.2, it occurred only 630 million years after the Big Bang and could be one of those first stars turning into a black hole. The infrared afterglow was captured by the Gemini Observatory as shown in Figure 08-15b. Observation on another cosmic blast GRB090102 indicates that there is a considerable polarization of the order 10% in the optical radiation (unusually high for astrophysical sources). The most logical - but not the only - explanation for the high degree of polarization is that the emitting source is permeated by |
Figure 08-15b GRB090423 [view large image] |
large-scale, ordered magnetic fields, and that the emission is non-thermal synchrotron emission from electrons as they spiral around the magnetic fields at relativistic speeds. |
 |
 |
Meanwhile, preliminary data for the energy spectrum of gamma-ray burst 120323A (Figure 08-15c, also see Nature News), discovered in March 2012 by the Fermi telescope, shows a bump that is likely to come from thermal emissions - casting doubt on a long-held view that synchrotron emissions alone could explain the bursts. The thermal emission could originate from the surface of a fireball as a spinning star collapses to form a black hole and explodes in a supernova as shown in Figure 08-15d. Since the GRB is much brighter than the quasars, it is now used to find out the chemical composition |
Figure 08-15c GRB120323A |
Figure 08-15d GRB Model [view large image] |
and evolution in the early universe at the epoch of a few hundred million years after the Big Bang. |
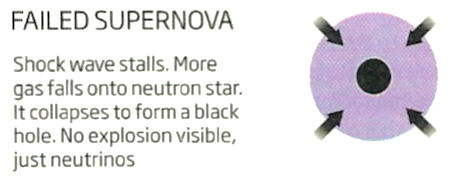 |
It is estimated that the observed number of supernovae is only about half of the prediction from theoretical calculation. One explanation proposes that some supernovae fail to explode because the shock wave has been stalled by the material rushing into the core (Figure 08-15e). The failed supernovae should produce huge amount of very energetic electron-neutrinos. If the next generation of neutrino detectors are able to detect the diffuse supernova neutrino background, then by comparing |
Figure 08-15e Failed Supernova [view large image] |
the spread of energies to those seen in the individual supernovae bursts, researchers will be able to work out the proportion of successful to failed supernovae. |
 |
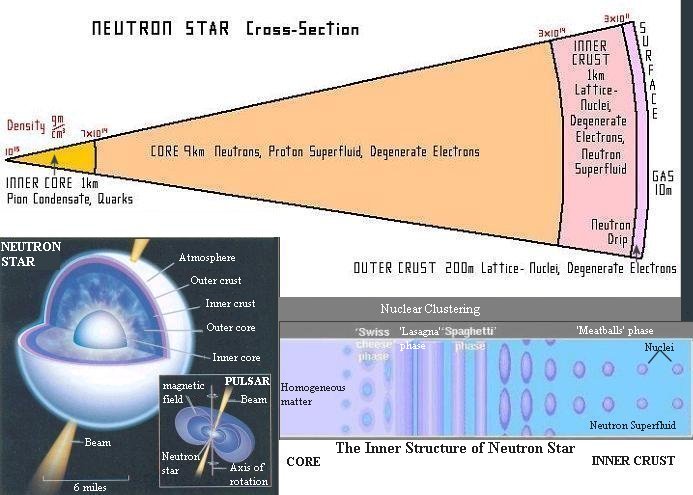 |
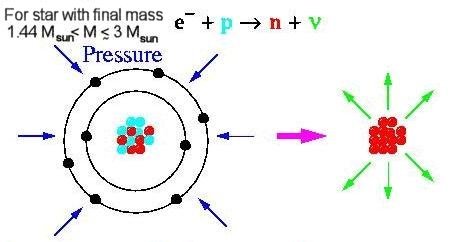
When the core of the star collapses to a density of about 1014 gm/cm3 (the same order of magnitude in the nuclei) it causes the atomic electrons to combine with the nuclear protons in the electron capture reaction as shown in Figure 08-16. This is the point where gravitational forces have won out over the pressure supplied by nuclear matter. Figure 08-17a shows the structure of a neutron star in several layers over a depth of ~ 10 km: |
Figure 08-16 Electron Capture |
Figure 08-17a Neutron Star, Structure |
 |
explained with the formation of superfluid in the core. The process releases neutrinos, which carry away a lot of energy. The charged protons there also make the core superconducting. The onset of superfluidity in materials on Earth occurs at extremely low temperatures near absolute zero, while it happens in neutron star at temperature near a billion degrees. The difference can be explained by the fact that the low temperature variety involves the very weak force between Cooper pair, while the interaction is via the strong nuclear force between nucleons in neutron star. This information may show us how to achieve superfluidity and superconductor at room temperature on Earth. The X-ray image in Figure 08-17b is colored in red (iron), green (silicon) and blue (synchrotron), optical data is in gold color. |
Figure 08-17b Superfluid in CasA [view large image] |
 |
compression (the percentage increase in pressure that accompanies a 1% increase in density). The boxes attached to the curve show what is happening to the microscopic matter as it is compressed from low densities to high. At normal densities, cold, dead matter is composed of iron. As the iron is squeezed from its normal density of 7.6 gm/cm3 up toward 100, then 1000 gm/cm3, the iron resists by the same means as a rock resists compression - the degeneracy-like motions of electrons. When the density has reached 100000 gm/cm3, the electron's degeneracy pressure completely overwhelm the electric forces with which the nuclei pull on the electrons. The electrons no longer congregate around the iron nuclei; they completely ignore the nuclei and form the electron gas moving around freely. At a density of about 107 gm/cm3 the motion of the electrons become relativistic (near the speed of light). |
Figure 08-18 Equation of State [view large image] |
 |
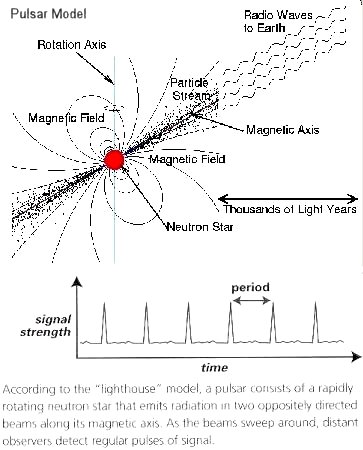 |
dense neutron star could spin this fast; larger stars (including white dwarfs) would be torn to shreds by centrifugal force. The magnetic field at the surface of a collapsing star grows in strength as the surface area of the star decreases (decreases in radius / increases in magnetic field strength ~ 1 / 105). The magnetic field strengths at the surfaces of neutron stars are likely to be between 108 and 1013 gauss. In some extreme examples (known as magnetars) they may be as high as 1015 gauss. Figure 08-19a shows the pulsar signal from the neutron star inside the Crab Nebula with a period of 0.03 sec in the X-ray range. |
Figure 08-19a Pulsar Signal |
Figure 08-19b Pulsar Model [large image] |
 |
 |
undergo a sudden small increase in rotation rate. These events, called glitches, are believed to be caused by "starquakes" that occur when the outer crust (a solid crystalline layer of heavy nuclei) slips to the fluid interior or by some abruptly adjustments. Extremely violent starquakes are believed to be induced when the intense magnetic fields of magnetars fracture their crusts. The energy released in such events may be responsible for producing the intense bursts of gamma rays that characterize objects called soft gamma-ray repeaters. Figure 08-19c shows the evolution of a neutron star to either a pulsar or magnetar. Figure 08-19d is an artist�s impression of a magnetar. A powerful |
Figure 08-19c Magnetar Pathway |
Figure 08-19d Magnetar [view large image] |
explosion just beneath a magnetar's surface has been detected by the XMM-Newton orbiting X-ray observatory in 2007. |
 -Sco, which could be the progenitor of the magnetar relating to the enigmatic fast radio burst (FRB) (See Phase (4) in Figure 08-19e, which depicts the evolutionary path of the merger).
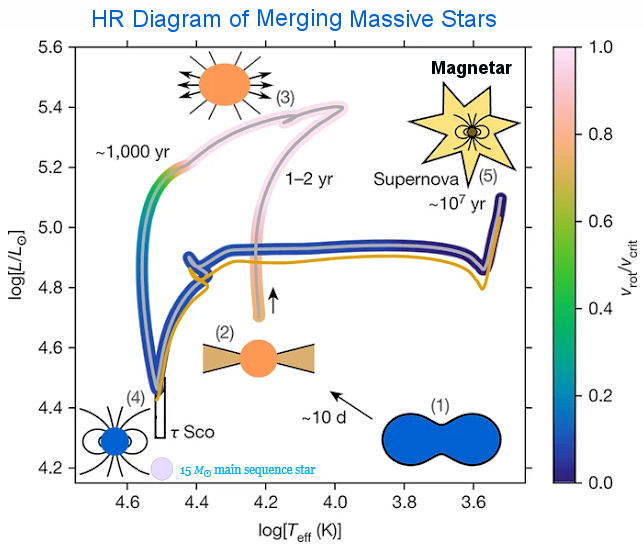 |
-Sco as indicated by the rectangle in Figure 08-19e. |
Figure 08-19e HR Diagram of Merging Stars to Magnetar |
See original article in "Stellar Merger as the Origin of Magnetic Massive Stars". |
| Subclass | Magnetic Field (Gauss) | Electromagnetic Radiation | Pulsation Frequency |
|---|---|---|---|
| Magnetar | 1013 - 1015 | X-ray, Gamma Ray | 1-0.1/sec |
| High-Magnetic-Field Radio Pulsar | 1013 - 1014 | X-ray, Gamma Ray | 1-0.1/sec |
| Isolated Neutron Star (INS) | 5x10¹² | X-ray | 10/sec |
| Radio Pulsar | 108 - 1013 | Radio | 0.1-105/sec |
| Rotating Radio Transient (RRAT) | 1010 | Intermittent Radio | |
| Compact Central Object (CCO) | 109 - 1010 | X-ray | |
| Millisecond Pulsar | 109
| Radio, X-ray, Gamma Ray |
100-1000/sec |
|
 |
In one theory, both the High-Magnetic-Field radio pulsar and INSs are the progenies of magnetars. The millisecond pulsars had been in the terminal phase of the pulsar evolution. They are now at the stage of spin-up, because they happen to be in a binary system, which enables their rejuvenation by accretion of matter from the other star. CCOs are the central object at the centers of supernova remnants. They pulsate irregularly only in X-ray. These objects may be born with slow spinning rate and low magnetic field. Many pulsars are surrounded by nebula with their intensely magnetized wind of highly energetic |
Figure 08-19f Subclass of Pulsars [view large image] |
particles resulting in dramatic morphologies such as the "Hand of God". Astronomers detect this "pulsar wind nebulae" only in the most powerful pulsars. |
 |
 |
GRBs are thought to be triggered by the collapse or merger of stars to form black holes at the end within a minutes or hours. Recently in 2010, observations from Fermi Gamma-ray Space Telescope, and the Swift satellite have allowed astronomers to learn more about the details of the explosions. It is reported that at least for one GRB an intermittent phase is detected. It lasted for hundreds of seconds and has the signature of a magnetar, the rapid rotation (with a rate of more |
Figure 08-19g GRB Light Curve [view large image] |
Figure 08-19h GRB 130427a [view large image] |
than one thousand per second) of which delays the eventual collapse to a black hold as shown in Figure 08-19g. |
 |
On April 27, 2013 a gamma-ray burst (GRB130427) was captured at its moment of eruption. The burst lasted for hours, and remained detectable for the better part of a day. One gamma-ray was recorded with an energy of 1011 Gev. Figure 08-19h shows images of the sky (North Galactic Pole at the center) before and after the eruption. The burst subsequently was detected in optical, infrared, and radio wavelengths by ground-based observatories. The view of the supernova will arrive by middle of May, 2013. |
Figure 08-19i GRB130427A Spectral Lags [view large image] |
 t = (D/c) (E/EQG,1),t ~ 300 sec, E ~ 100 Gev (from Figure 08-19i), we obtain EQG,1 ~ 0.04 EPlanck, which seems to be too low for the granular structure of space to show up.
