

| Home Page | Overview | Site Map | Index | Appendix | Illustration | Preface | Contact | Update | FAQ |
|
|
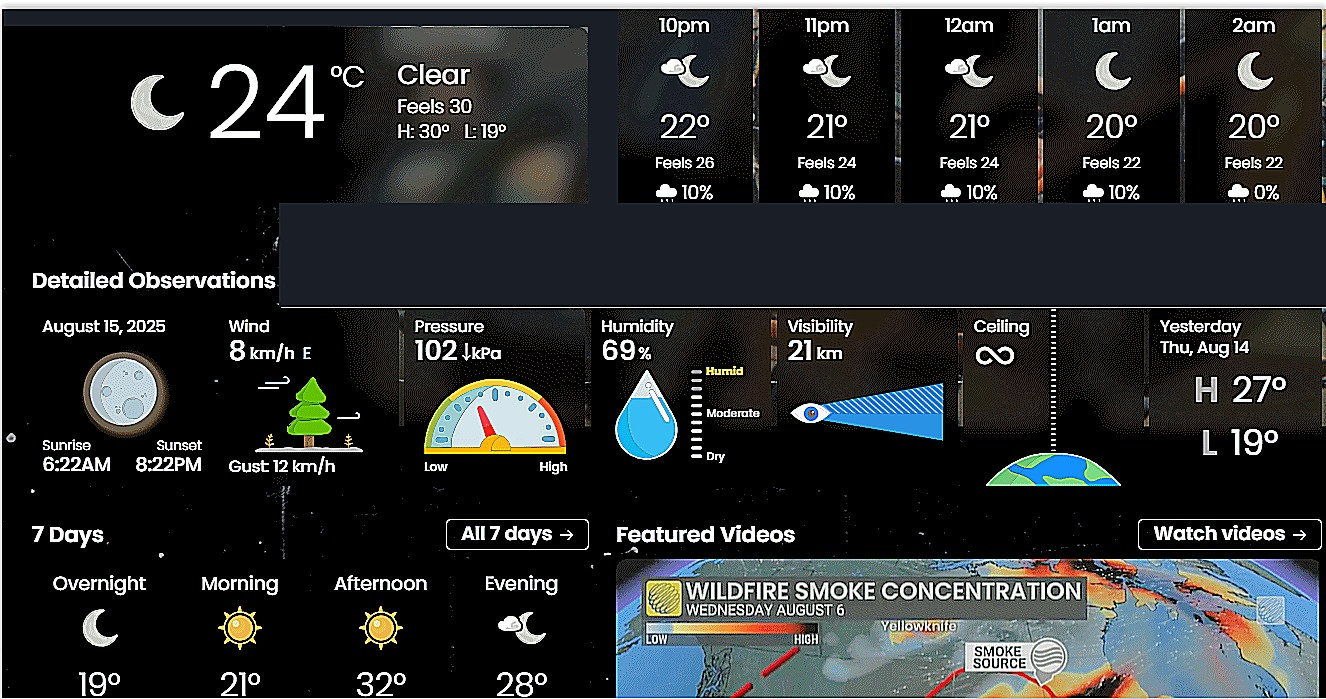
Weather is defined as the atmospheric conditions at a particular time and place; climate is the average weather conditions for a given region over time. Weather conditions include temperature, wind, cloud cover, and precipitation, such as rain or snow. Good weather is generally associated with high-pressure areas, where air is sinking. Cloudy, wet, changeable weather is common in low-pressure zones with rising, unstable air. But long-term weather prediction is unreliable as shown in the Chaos Theory. |
Figure 09-09a Non-rotating Flow |
Figure 09-09b Air Circulation |
 |
The movements of the large air masses are controlled primarily by the strong winds that blow continually at high altitudes. Around the polar low, the atmospheric circulation is counterclockwise (toward the pole and then up, see Figure 09-09b). This upper-air westerlies do not move along circular paths; instead, they meander north and south in a wavy patterns. The high pressure front acts like a wall to control the flow and the Coriolis force deflects the air movement toward the east. They are particularly well developed in the altitude range from 10 to 12 km, where a narrow band of air moves with speeds of 350 to 450 km/hr. This high-speed river of air is called the jet stream (Figure 09-09c), which separates the cold and warm air masses. Weather condition is very different from one side of the jet stream to the other. |
Figure 09-09c Jet Stream |
 |
An air mass is a vast body of air (often covering several thousands of km2 wide and several km thick) in which the conditions of temperature and moisture are much the same at all points in a horizontal direction. It takes on these characteristics of the surface over which it forms. Air masses that affect the weather move across the country and carry with them the temperature and moisture of their origin. An air mass is modified by the surface over which it moves, but its original characteristics tend to persist. High-pressure ridges may develop any place where air cools, compresses, and sinks. Conversely, low-pressure cells form under the opposite conditions. |
Figure 09-10 Air Masses [view large image] |
 |
 |
of air at the central core before it can flow away. The congestion increases the air density and results in a relatively high, central-pressure zone. As the air diverges from the central region, it is deflected by the Coriolis force in a clockwise circulation (Figure 09-11a). Thus, most Highs are generally elliptical in shape following their formation. But as they interact with other air masses and topography, and are distorted by forces of the upper atmosphere, high pressure cells often become long |
Figure 09-11a High Pressure Ridge |
Figure 09-11b Low Pressure Cell |
and narrow in shape, and is referred to as high pressure ridge in the weather map. Since the air at high altitude is dry, the High is usually associated with fair weather. |
 |
Fronts form at the boundary when air masses collide. The colder air mass pushes under the warm one and lifts it. Then, if the boundary doesn't move, the front becomes stationary. Usually, it does move, and one air mass pushes the other along. If the cold mass pushes the warm air back, it is called a cold front. If the cold air retreats with the warm air pushing over it, it is called a warm front. In either case, frontal weather is either unsettled or stormy. Fronts usually bring bad weather. |
Figure 09-12 Weather Front |
All fronts have the following characteristics in common (see Figure 09-12): |
 |
 |
Cold fronts usually advance at speeds of about 30 km/hr (faster in winter). Although the sloping edge of a cold front may extend over several hundred kilometers horizontally, the steepness of the advancing edge means that frontal weather is limited to an extremely narrow band. Storms at a cold front are generally brief though violent. Occluded front is the result of cold front catching up with warm front. The warm air is forced up away from ground level (see diagram f in Figure 09-13 or its animated version). |
Figure 09-13 Types of Front [view large image] |
Figure 09-14a Types of Clouds [view large image] |
 |
levels of these two attributes are related. It also shows that the most recent increases are occurring at rates that have not been observed since the end of the last ice age and have only previously been observed in association with dramatic shifts in climate. It is generally assumed the dramatic increase in carbon dioxide concentration in the atmosphere over the past 150 years is largely due to anthropogenic (human-caused) effects. Human beings are causing the release of carbon dioxide and other greenhouse gases to the atmosphere at rates much faster than the earth can recycle them. Fossil fuels - oil, coal, natural gas, and their derivatives - are formed through the compression of organic (once living) material for millions of years, and we are burning billions of tons of these fuels per year. The CO2 expelled into the atmosphere through these activities does not disappear immediately or even over the course of a year. As a matter of fact, the residence times of greenhouse gases (how long they remain in the atmosphere) are on the order of decades to centuries. This means that the impact will be accumulated well into the future of many generations. |
Figure 09-16 Global Warm- ing |
 |
 |
century. Worldwide precipitation over land has increased by about one percent. The frequency of extreme rainfall events has increased throughout much of the United States. Figure 09-17b shows the greenhouse effect from human activities (agriculture, industrialization) warded off a glaciation that otherwise would have begun about 5000 years ago. |
Figure 09-17a Rising Temp- erature |
Figure 09-17b Greenhouse Effect [view large image] |
For more details on global warming, go to the 2007 IPCC (Intergovernmental Panel on Climate Change) website. |
 |
There is no unanimous agreement on the cause of glaciation. One explanation involves plate tectonics. The movement of landmass to higher latitudes from tropical regions is responsible. Another explanation is known as the Milankovitch cycle (Figure 09-17c). It describes the way Earth's orbit gradually changes shape from a circle to a slight ellipse (eccentricity, curve a) and back again roughly every 100,000 years in exact agreement with the period between ice ages. Other causes include the tilt of the Earth's axis (obliquity, curve b), which takes 41,000 years to complete a cycle; and the top-like wobble (precession, curve c) of the Earth's axis, which follows a 23,000-year cycle. These other effects generate the secondary variations within the main cycles. |
Figure 09-17c Ice Age Cycles [large image] |
