Home Page Overview Site Map Index Appendix Illustration About Contact Update FAQ


Mulitcellular Organisms


Future of the Human Race

World Model 1 World Model 2 
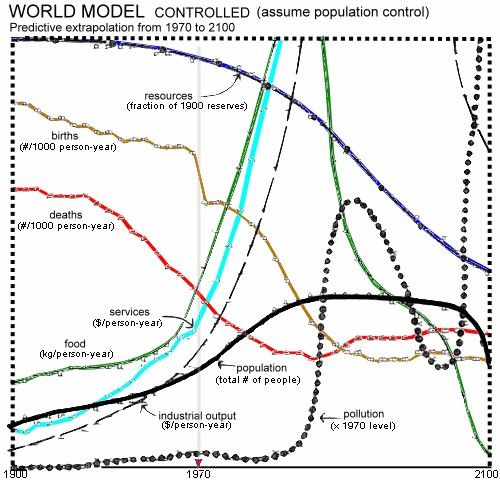
Figures 10-36 and 10-37 show two world models among many others, which were built specifically to investigate five major trends of global concern - accelerating industrialization, rapid population growth, widespread malnutrition, depletion of nonrenewable resources, and a deteriorating environment. Like every other model, they are imperfect, oversimplified, and unfinished. The horizontal time scale is also vague because the model just indicates the general behavior, the numerical values are not as significant as some critic would like to ascribe. The model uses feedback loop similar to the logistic equation to trace the development of the eight variables as labeled without scales in the diagrams.

Figure 10-36a World Model, Standard [view large image]

Figure 10-36b World Model, Controlled [view large image]

World Model Feedback Loops 
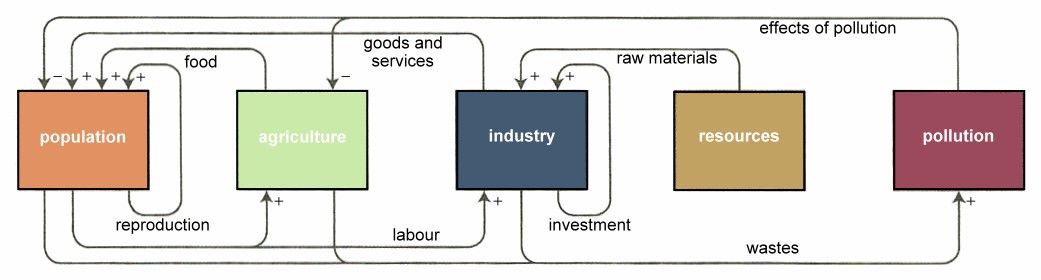
The 5 main sectors of the "World3" model are illustrated schematically in Figure 10-37. The positive and negative feedback loops are labeled with the '+' and '-' sign respectively. The equations for the sector are in the form :
Si(n+2) = Si(n) + [P(n+1) + N(n+1)] dt

Figure 10-37 World Model Feedback Loops [view large image]

where Si(n+2) and Si(n) are the value of the sector at time t(n+2) and t(n) respectively, P(n+1) and N(n+1) the rate of positive and negative feedback in between the interval dt = t(n+2) - t(n). The rate equations for each sector is

dSj/dt = kjSj, where kj is the rate constant, P(n+1) and N(n+1) are sum of the contributions from these. In the numerical computation, the sector and rate equations are evaluated in alternation, i.e., the sector at t(n) determines the rate at t(n+1), which determines the sector at t(n+2), and so on. Among the 150 equations of the World3 model there are 12 main sector equations and 21 rate equations. The rest are auxiliary equations of various kinds making a web of tangled pathways. There is an online program that let the user to plot the "growth" curves with different combination of input data (the browser has to be Firefox, Google Chrome, Safari or Opera, Version 9.0 of Internet Explorer may also work).

The original idea of world model came from J. Forrester of MIT at a "Club of Rome" (billed as a global think tank and centre of innovation and initiative) meeting in 1970. The study was conducted by an international team with financial support from the Volkswagen Foundation. The research has been completed by 1972 with the publication of "The Limits to Growth". While critic in the 21st century points out that the dire prediction in the models has not been materialized in the 1990's, the proponents maintain that the warning from the "Club of Rome" remains valid. There are already situations where the trends have been realized. It seems that both sides of the debate have over-estimated the power of a model. Any computer model is, by definition, a simplified version of the real world, its predictions vulnerable to some neglected factor or changing circumstance. The Limits to Growth just revealed some important aspects of the challenges faced by society today.

Figure 10-36a is the "standard" world model, which assumes no major change in the physical, economic, or social relationships that have historically governed the development of the world system. All variables plotted follow the historical values from 1900 to 1970. Food, industrial output, and population grow exponentially until the rapidly diminishing resource base forces a slowdown in industrial growth. Because of natural delays in the system, both population and pollution continue to increase for some time after the peak of industrialization. Population growth is finally halted by a rise in the death rate due to decreased food and medical services.

World Model 1 
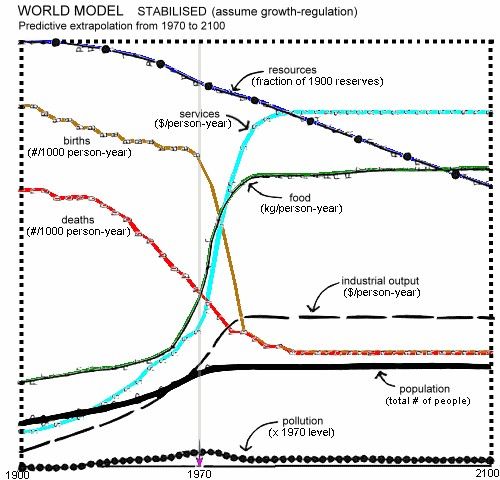
It has been shown that positive feedback loops operating without any constraints generate exponential growth. In the world system two positive feedback loops are dominant now, producing exponential growth of population and of industrial capital. In any stabilized system there must be constraints acting as feedback loops to stop exponential growth. The growth stopping pressures from negative feedback loops are already being felt in many parts of human society. Another response to the problems created by growth would be to weaken the positive feedback loops that are generating the growth. Such solution involves growth-regulating policies, which generates a "better" behavior mode. Figure 10-38a shows a world model with regulating policies to produce an equilibrium state sustainable far into the future.

Figure 10-38a World Model, Stabilized [view large image]

    The policies that produced the stabilized world model are:

  1. Population is stabilized by setting the birth rate equal to the death rate in 1975. Industrial capital is allowed to increase naturally until 1990, after which it, too, is stabilized, by setting the investment rate equal to the depreciation rate.
  2. To avoid a nonrenewable resource shortage, resource consumption per unit of industrial output is reduced to 1/4 of its 1970 value.
  3. To further reduce resource depletion and pollution, the economic preferences of society are shifted more toward services such as education and health facilities and less toward factory-produced material goods.
  4. Pollution generation per unit of industrial and agricultural output is reduced to 1/4 of its 1970 value.
  5. To avoid food shortage, capital is diverted to food production even if such an investment would be considered "uneconomic".
  6. This policy alters the use of agricultural capital to make soil enrichment and preservation. It implies, for example, use of capital to compost urban organic wastes and return them to the land.
  7. To counteract the drains on industrial capital resulting from the above-mentioned policies, the average lifetime of industrial capital is increased, implying better design for durability and repair and less discarding because of obsolescence. This policy also tends to reduce resource depletion and pollution.
Implementation of this set of policies required government intervention and control of industrial and agricultural activities as well as family planning and also implies interference of people's daily life. Certainly, it would generate a lot of resistance, and there would be many non-believers. New approach have been developed by focusing on flexibility to strike a balance between the economy and the environment (e.g., we can set a goal for cutting pollution but relax the deadline if the cost runs too high).

World Model Update
    The conclusions of The Limits to Growth:

  1. If the present growth trends in world population, industrialization, pollution, food production, and resource depletion continue unchanged, the limits to growth on this planet will be reached sometime within the next 100 years. The most probable result will be a rather sudden and uncontrollable decline in both population and industrial capacity.
  2. It is possible to alter these growth trends and to establish a condition of ecological and economic stability that is sustainable far into the future.
  3. If the world's people decide to strive for this second outcome rather the first, the sooner they begin working to attain it, the greater will be their chances of success. That is, the sooner the better.
An updated study in 2005 arrives at essentially the same conclusions although some trends like

Figure 10-38b World Model Update [view large image]

the birth rate has become more optimal than predicted (see Figure 10-38b dotted curve, otherwise it is similar to Figure 10-36 but in colour now). The message is the same: we should act sooner.

A British government report released in October 2006 warns that global warming could have a disastrous effect on the world's economy, shrinking it by 20%. Then BBC ran a broadcast in the evening news (see full text) to give the view on climate change from around the world. It seems that while the rich nations do not want to give up their life styles, the developing countries are all striving to catching up, the under-developed world needs help, and the animals bear all the consequences not by their making. The majority put short-term gain ahead of long-term survival. Meanwhile, nature would not wait for our procrastination; the glaciers simply melt faster as we burn more
Global Warming Ice Shelf Breakup 
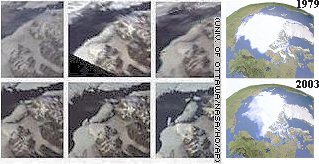
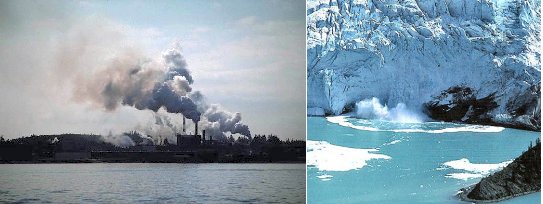
fossil fuels (Figure 10-39a). The perennial sea-ice has been breaking up and shrinking at an alarming rate of about 7% every decade since the 1970s. The images in Figure 10-39b compare the annual sea ice minimum in 1979 and 2003. The same picture also shows satellite images of a big chunk of ice shelf breaking up from the Ellesmere Island in the Canadian Arctic at the end of 2006.

Figure 10-39a Global Warming
[view large image]

Figure 10-39b Arctic Ice, Disappearing

In addition to warming up the atmosphere, we are also guilty of plundering the sea and polluting the land. In view of the threat of global warming, the doomsday clock has been advanced 2 minutes
in January 2007 to 5 minutes before the end. It is again in 2 minutes now (see doomsday clock January 2018).

Figure 10-39e depicts the consequence of warming up the Earth by 4oC. It predicts:
  • Most of the tropical regions between 30o and -30o latitude will become uninhabitable desert.
  • Warmer World
  • Even if parts of the region have not been consumed by desertification, floods, drought or extreme weather will render such areas uninhabitable.
  • Monsoon rains may lead to greening (reforestation) of a small portion of the tropic.
  • Some coastal area and islands will be lost to rising sea levels (assuming a 2-meter rise).
  • Human population will re-settle into the polar and sub-polar regions, which become food-growing zones.
  • The abandoned tropical regions will be utilized to produce solar, geothermal, and wind energy.
  • Human population will decline by the billions if the changeover process is not well managed.
  • Figure 10-39e A Warmer World [view large image]


  • Human survival depends very much on whether the CO2 level can be reduced to 280 ppm (to the 1900 level as shown in Figure 10-39c). The natural reglation by marine animals turning CO2 into calcium carbonate shells does not work any more because the man-made increase has risen 14000 times as fast as the average of the past 610000 years.
  • The 2013 IPCC report contains no surprise except for its acceptance that warming has slowed since 1998. Nevertheless, the range of temperature rise (from 0.3 - 4.8 oC) has prompted the "New Scientist" to initiate a study of the effects of four different scenarios on the global environment in 2100 (published in its October 5-11, 2013 issue). The results are summarized in Table 10-08 below.

      Geoengineered Safety Slight Delay Too Little Too Late Addicted to Carbon
    Scenario Act now on renewable energies and geoengineering Delayed action on renewable energies and geoengineering Emission is cut late in the 21st century Booming world economy is fuelled by coal and oil
    Population 9 billion 8.5 billion 9.5 billion 12.5 billion
    Global Energy Use 8x10²⁰ joules 1021 joules 8x10²⁰ joules 1.75x10²¹ joules
    CO2 Concentration 400 ppm, dropping 500 ppm, stable 650 ppm, rising 950 ppm, rising
    Sea Level Rise 0.26 - 0.55 m 0.32 - 0.63 m 0.33 - 0.63 m 0.45 - 0.82 m
    Temperature Rise 0.3 - 1.7 oC 1.1 - 2.6 oC 1.4 - 3.1 oC 2.6 - 4.8 oC

    Table 10-08 The 4 Scenarios for Climate Change

    There are plenty of examples for civilization in ruins. The Maya, the Anasazi, the Easter Island, ...are known cases of failed societies. The Maya had the technological knowledge to build architecturally wonderful cities (Figure 10-40). What they did not have were large domestic animals, or the foresight to replant after they clear-cut forests, or the political sense to refrain from inter-city warfare. They began to go into decline about A.D. 1000 and were finished off by the Spaniards about 1675. The Anasazi, settled in the New Mexico area about A.D. 600. There they built spectacular cliff housing, worked their marginal agricultural land, and chopped down all the trees without any plans for reforestation. Starving to the point of cannibalism, wracked by internecine warfare, they met their end some 600
    Mayan Ruins Deforestation 
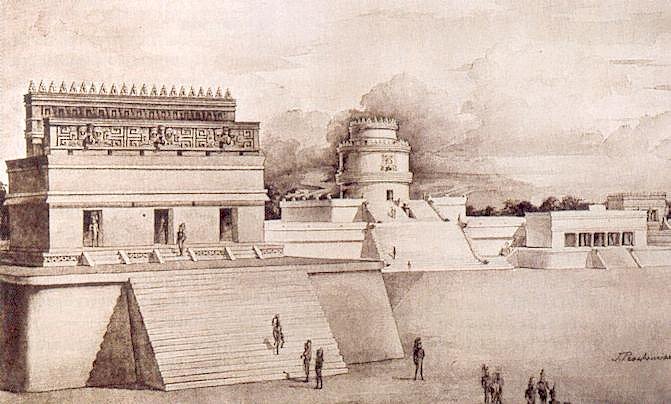
years later. Other fallen Island societies, such as the one on Eastern Island, all collapsed after the settlers had exhausted the fragile food and timber resources. Deforestation (Figure 10-41) was particularly critical; after the larger trees were harvested, nothing was left to make the seagoing canoes needed for voyaging to other sources of food and material. A common thread in the catastrophic collapse of past civilizations is a tendency to impose self-inflicted environmental degration, and unwise responses to societal

    Figure 10-40 Mayan Civilization [view large image]

    Figure 10-41 Deforestation
    [view large image]

    problems such as using war as an instrument to resolve disputes, which mostly involve the sharing of resources - it is mostly about oil in this epoch of civilization.

    Model simulation in 2014 (see "Modeling Inequality and Use of Resources in the Collapse of Societies") adds another dimension to the evolution of societies. It shows that inequality together with depletion of resource would make the collapse inevitable, while each one alone may not be sufficient to pull the trigger. The problem with inequality may be resolved by new technology and/or replenish resource even though the rich refuses to share (usually on the pretext of meritocracy). Downward slide to collapse begins with protests and civil unrests and ends up with full scale revolution and civil war (see "Inequality Study Hints Revolution is in Store for U.S."). Actually, any catastrophic event would have the same effect to re-distribute the wealth. Figure 10-42 shows the GINI coefficients for most countries in a scale from 0 (absolute equality) to 1 (absolute unequality). The alarming level is somewhere in between 0.4 and 0.5. It is suggested that collapse can be avoided, and population can reach a steady state at maximum carrying capacity if the rate of depletion of natural
    Income Inequality Collapse of Empires resources is reduced (e.g. by controling population growth) to a sustainable level and if resources are distributed equitably (e.g., by progressive taxation), both of which are unlikely to happen. Figure 10-43 shows the 1918 version of the "Grownth and Decline Cycle" by comparing the cultures of eight ancient civilizations and treating each one as living organism. The same kind of pattern is repeating all over in the modern world. When will they ever learn ?

    Figure 10-42 Income Inequality
    [view large image]

    Figure 10-43 Collapse

    Looking for a symptom of collapse ? Just check out this old Chinese saying : "The decay of nation always goes with some unsavory characters" (國之將亡,必有妖孽).
    The original text : . Roughly translated from Sima Qian's voluminous Book of History (史記) : "... unsavory characters always preside over the collapse of the kingdom."   Sima Qian 司馬遷 (a Chinese historian in the Han dynasty 206 BC - AD 220) recorded history objectively until the end of each episode, where a very short personal opinion is appended. He has conclusively demonstrated that the key to the success or failure of a nation depends on its leaders. However, the civilized and modernized nations today continue to repeat the same mistake and re-play such long-running melodrama again and again.

    Assuming that we are able to survive our self-inflected degradation, it is suggested that there are several directions for future evolution of the human race (as portrays in Figure 10-44):
    Evolution of Human Race
  • Natural selection -- This is the path for human evolution millions of years in the past. As human population migrated to different kinds of environments in the last 2 million years, it developed into different races with different body types, eye folds, skin colors, and curliness of hair. These groups retained just enough connections with one another to avoid evolving into separate species. With the globe fairly well covered, one might expect that the time of evolving was pretty much finished. It turns out not to be the case. Genetic studies reveal that more than 300 regions on the human genome showed evidence of recent changes mostly related to improve people's chance of surviving and reproducing. Examples included resistance to diseases, changes in skin pigmentation in African; hair follicles among Asians, and more competent sperm (because our species is not exactly monogamous).
  • Figure 10-44 Evolution of Human Race in Future
    [view large image]

  • Un-natural selection -- This is related to the changes in living conditions brought about by agriculture and cities. For example, few people in China and Africa can digest fresh milk into adulthood, whereas almost everyone in Sweden and Denmark or North America can. This ability presumably arose as an adaptation of dairy farming.
  • Reverse selection -- As the mobility of humanity in modern time brings about the homogenization of our species, at the same time natural selection is being thwarted by our technology and our medicines. In most parts of the world, people with genetic damage that was once fatal now live and have children. Culture, rather than genetic inheritance, is now the deciding factor in whether people live or die. Such circumstance leads to the controversial suggestion of selection in reverse, when evolutionary change does not make us fitter for survival. Modern health care keeps unfit individuals to reach reproductive age and give them a chance to have children, who would then spread the bad genes further. This kind of idea evokes the ghost of eugenic movement found in the 19th century that proposed controlled improvement of the human race through selective breeding. It was practiced in Nazi Germany with sterilization of 400,000 "undesirables" against their will. Modern scientists now recognize that environmental influence is just as important as heredity in the development of an individual.
  • Directed evolution -- We have directed the evolution of so many animal and plant species, it's about time that we do something on our own behalf. Geneticists are now tracking down hundreds of serious genetic disorders, from cystic fibrosis to early-onset cancers. Potentially, those would-be parents at risk with such disorders will be offered IVF (In Vitro Fertilization) with pre-implantation genetic diagnosis (IVF-PGD) to ensure any children are healthy. IVF-PGD is not exactly for creating designer babies. It cannot select for traits the parents don't have; it just makes sure children do not end up with disastrous genetic disorders. There are two ways to alter people's genes, e.g., by changing genes in the relevant organ only (gene therapy) or by changing the entire genome of an individual (germ-line therapy). The major obstacle to genetic engineering in humans is the sheer complexity of the genome. Genes usually perform more than one function; conversely, functions are usually encoded by more than one gene. Because of this property, known as pleiotropy, tinkering with one gene can have unintended consequences. But the motive is there; parents always want their children with enhanced intelligence, looks and longevity. If germ-line therapy become viable someday, a new species of super-human may conceivably emerge through self-imposed geographic or social segregation.
  • Coexistence with Machine -- In this modern age, we are already very much dependent on machines. As much as we build them to meet our needs, we have structured our own lives and behavior to meet theirs. As machines become ever more complex and interconnected, we will be forced to try to accommodate them. Darwinian evolution may be a victim of its own success, unable to keep
    Coexistence with Machine up with non-Darwinian processes that it has spawned. Our technological prowess threatens to swamp the old ways that evolution works. One view maintains that past record of success gives us good grounds for thinking that coevolution (biological and technological) will continue to lead in desirable directions. A darker view envisions that various mechanical / electronic components will eventually link up together to create a being superseding human kind. Figure 10-45 presents the two views of human-machine coexistence.

    Figure 10-45 Coexistence with machine

    The picture on the left shows a harmonious relationship with robot and human dancing together, while the one on the right portrays a rather intimidating computer system such as the HAL 9000 in "2001: A Space Odyssey".

    A 2009 report indicates that evolution is alive and well in modern women. Study of 14000 medical records over three generations concludes that by 2409 the average woman will be 2 cm shorter and 1 kg heavier. She will bear her first child about 5 months earlier and enter menopause 10 months later. Since the research was controlled for many social and cultural factors, it is likely that the results points to genetic, rather than cultural evolution at work.

    Go to Top of Page to Select
     or to Main Menu

    .