
| Home Page | Overview | Site Map | Index | Appendix | Illustration | About | Contact | Update | FAQ |
|
|
The Bragg (father and son) pioneered the discovery to discern the structure of crystals in early 20th century. They took the diffraction pattern resulting from the interaction between the atoms (in the crystal) and X-ray and developed a formula to find out the inter-atomic distance. The method is |
Figure 13-04a X-ray Diffraction [view large image] | Figure 13-04b XRD Pattern |
now widely used in molecular biology and biochemistry as well. The following provides a brief explanation for the process. |
 |
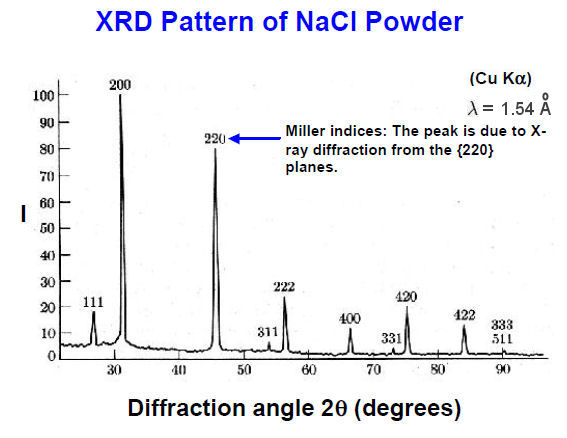
spots around the central point. The formula for such constructive interference is : 2d sin(  ) = n ) = n  where d is the spacing between Bragg planes, is the incident angle, is the wavelength, and the integer n is the order of the scattered beam, e.g., higher number of n corresponds to bright spot further away from the incident direction. The angular range of the diffractometer usually restricts n to be 1.
|
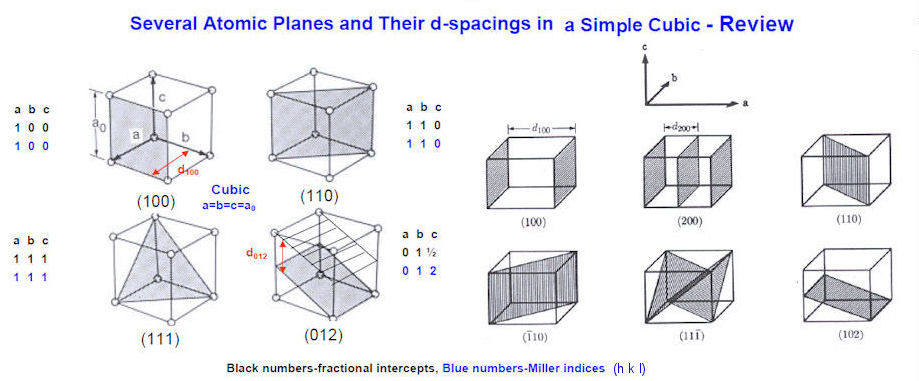
Figure 13-04c Miller Indices |
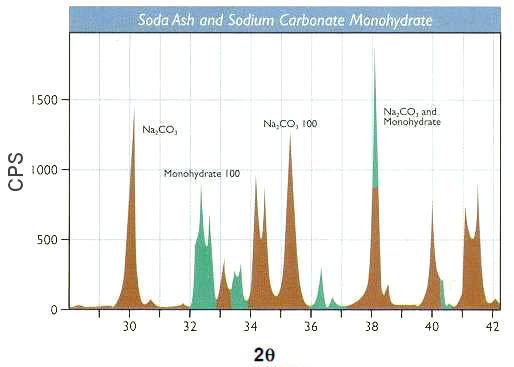 |
it is not necessary to orient the crystal in various positions to obtain diffraction patterns for different Bragg planes. Figure 13-04b plots the intensity of the scattered waves versus twice the incident angles obtained by the diffractometer similar to the one shown in Figure 13-04a. The graph shows the intensity variation produced by the various Bragg planes. The International Centre for Diffraction Data maintains JCPDS (Joint Committee on Powder Diffraction Standards) cards for about 500,000 powder diffraction patterns (as of 2006), which can be used to identify substances in a given diffraction pattern such as shown in Figure 13-04d (CPS stands for counts of X-ray photons per second). |
Figure 13-04d Powder Diffraction [view large image] |