| Home Page | Overview | Site Map | Index | Appendix | Illustration | About | Contact | Update | FAQ |
 |
 |
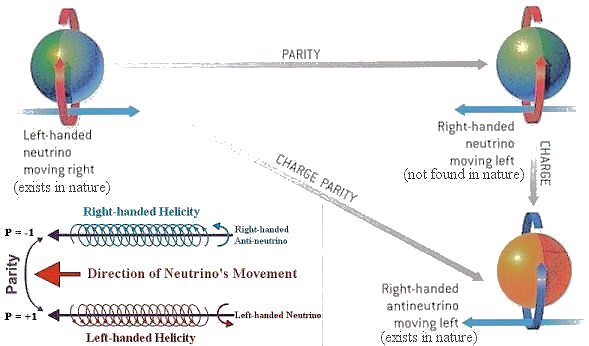
As shown in Figure 01, charge conjugation (C) reverses the sign of electric charge, changing a particle to its antiparticle. Parity (P) reverses the arrow on all vectors associated with the object. The laws of classical mechanics and electromagnetism are invariant under either of these operations, as is the strong interaction of the Standard Model. These symmetries however, are broken in the weak interaction. For many years, it appeared that the combined operation |
Figure 01 CP Invariance |
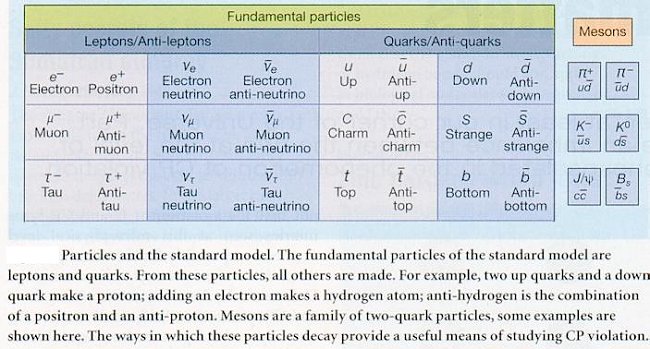
Figure 02 Elementary Particles
|
(CP) were invariant even for weak interactions until it was shown to be otherwise in 1964. |
 |
decays into two charged pions (with CP=+1); the other is Klong with longer half-life, a CP state of -1 and decay into three neutral pions (with CP=-1). The 1964 experiment by Cronin and Fitch looked for the decay products of Klong. They observed a few decays of the Klong turning into pairs of oppositely charged pions: about 1 out of a total of 500 decays. This kind of decay arrives at a final CP state that is different from the initial CP state and proves that CP symmetry was not preserved exactly by the weak interaction. |
Figure 03a Ko Meson Decays |
 |
meson decay instead of -1/5000 calculated from the Standard Model. This result indicates that it requires new physics / new particle to explain the discrepancy (at 99% confidence level). The neutral B meson has the special property that it oscillates between the matter and anti-matter states as shown in Figure 03b (with the decay products of either a muon or anti-muon), where N--, N++ are the number of events corresponding to the matter or anti-matter mode respectively, and Aslb is the degree of CP violation. For an universe with perfect CP symmetry this number |
Figure 03b Neutral B Meson Decays |
would be zero. Deviation from zero is first derived from the Standard Model (not quite enough with the fact that we are here), and now the new data requires a new theory to explain. |
 ij, sij = sin
 ij , where
  ij is the rotation angle in the internal space of the quark fields, and the phase angle
  turns some matrix elements into complex numbers, thereby violating CP invariance. The first form of the CKM matrix V in Figure 04 denotes a general unitary matrix, the second form is a more particular one advocated by the Particle Data Group, and the third form contains the magnitudes for each matrix element determined by experimental data (the phase angle responsible for CP violation is determined by another method below).
 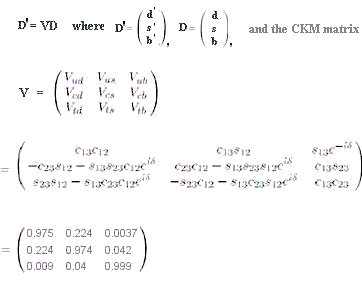 |
called "coupling constant" containing real and imaginary parts in general, i.e., it is a complex number. The set of coupling constants can be represented by the 3x3 CKM matrix (see Figure 04). In contrast with electric charge, which seems to come in a well-defined universal unit, each of these nine coupling constants is different. The triumph of the Standard Model is that it predicts a set of relationships between the nine elements of the CKM matrix and it predicts that they include properties that result in CP violation. The CP violation is related to the fact that the matrix elements include imaginary numbers. If we look at enough decays that involve the different matrix elements, we can see whether the relationships are true (there are only four independent parameters in the matrix). |
Figure 04 CKM Matrix |
 + 1 + |VtdV*tb|/|VcdV*cb| ei
 = 0
= 0  = arg(VtdVtb*/|VcdVcb*|), i.e., the polar angle of the complex number VtdVtb*/|VcdVcb*|, to determine the degree of CP-violation in Bo decay. The different modes of decay are also indicated in the diagram; D is the D meson containing a charm quark and a light quark.
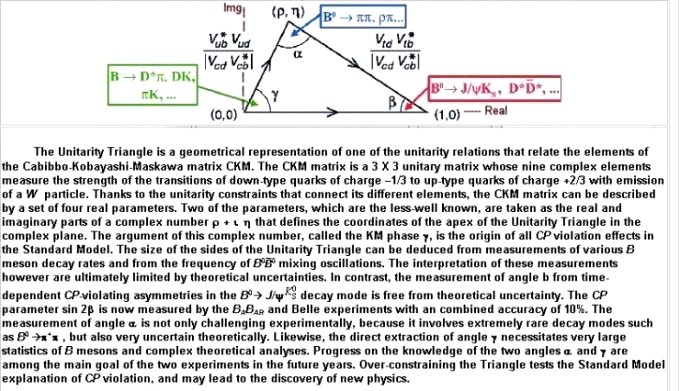 |
Figure 05 Unitarity Triangle |
 have very small branching ratios and in general low efficiencies for complete reconstruction of the final state. It is therefore necessary to produce a very large sample of B mesons to perform a CP measurement. At the High Energy Accelerator Research Organization (KEK) in Japan and the Stanford Linear Accelerator Center (SLAC) in California, accelerators have been designed to produce a plentiful supply of B mesons, through specially tuned electron - positron collisions. At each facility is a detector (Belle in Japan, and BaBar in California)
 |
to pick up and study the decays of the many millions of B mesons created - hence these facilities are known as "B factories". Figure 06 shows the BaBar detector and the particle tracks from the B meson decay. The latest measurements yield a value of sine(2 ) = 0.78 ) = 0.78  0.08, which is exactly that needed to explain the magnitude of CP violation seen in the Cronin-Fitch experiment. However, these measurements also predict a value of one leftover proton to 1018 photons (resulting from the annihilation of particles and antiparticles). It is in disagreement with the observation of one in 109 by many order of magnitude. 0.08, which is exactly that needed to explain the magnitude of CP violation seen in the Cronin-Fitch experiment. However, these measurements also predict a value of one leftover proton to 1018 photons (resulting from the annihilation of particles and antiparticles). It is in disagreement with the observation of one in 109 by many order of magnitude.
|
Figure 06 B Meson Decay |
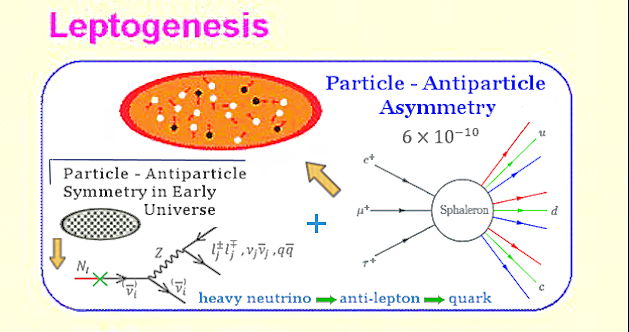 |
baryogenesis) suggests that an exceptionally heavy but unstable breed of Majorana neutrino existed in the very early universe. Their subsequent decay generated more anti-leptons than leptons. A mechanism called "Sphaleron" then converted 1/3 of the excess anti-leptons into baryons leading to the imbalance between matter and antimatter at the dawn of time. Theoretical analysis shows that leptogenesis works best when the neutrino masses are in the range 0.1 ev - 1 mev; the mass of the Majorana neutrino and the reheating temperature must be larger than 109 Gev. |
Figure 07 Leptogenesis |
Such theory is the most favored mechanism to explain the matter anti-matter asymmetry because there is good circumstantial evidence for existence of various ingredients (except the requirement of heavy Majorana neutrino at reheating when particles were massless according to SM). |
 |
An experiment to look for neutrinoless double-beta decay (NDB, see Figure 08) is running since 1990 at the Gran Sasso laboratory near Rome. The claim for discovery is still in dispute. But the findings could confirm the neutrinos' changing behaviour (flip-floping between antineutrino and neutrino as shown in the lower diagram of Figure 08), and the existence of an extremely heavy form of neutrino at high temperatures (such as in the aftermath of the big bang). Note that the antineutrino disappears with the addition of one more proton (a baryon) in the NDB process. |
Figure 08 NDB Decay |
 |
 |
The NDB detectors are made from hundreds kilograms of appropriate isotope (such as the Germanium Detector Array in Figure 09) buried thousand meters underground to screen out cosmic radiation and covered with lead to block out unwanted radiation from other radiative elements. The signature for NDB (in lieu of the ordinary double-beta decay, see Figure 10) is revealed by definite energy of the two electrons (the end products) with the peak at about 2x10³ kev. This is exactly |
Figure 09 Ge Detector |
Figure 10 Double-beta Decay [view large image] |
what the Gran Sasso lab has observed with 15 events in about 10 years from 1990. More careful work in 2006 eliminated 4 of these events. They also estimated the half-life of the NDB to be 2.2x1025 years and |
 |
|
Figure 11 Leptogenesis, |
 is similar to the last term of L3 with R (the right-handed lepton field) replaced by N (the right-handed heavy neutrino field) :
 |
 |
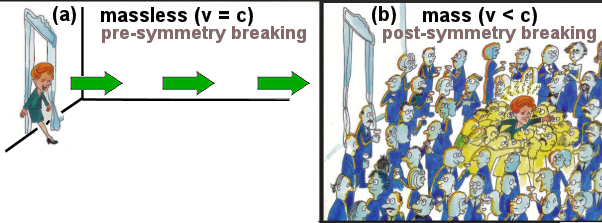
Figure 12 Speed of Massless and Massive Particle [view large image] |
(see Figure 12). |
 |
|
Figure 13 Lepton Lagrangian [view large image] |
This condition determines the time when equilibrium is reached in relation to the processing of the following differential equations. The rate of cosmic expansion slows down over time, i.e., non-equilibrium previals mostly at earlier time. |

 ~ 1012 sec-1 similar to many present-day meson decay.
 |
where R is the scale factor for measuring the relative scale of the universe (R = 1, for the current epoch). The formula is : H = (8  G G /3)1/2 ~ 2.4x10¹² sec-1 (for t ~ 10-12 sec), /3)1/2 ~ 2.4x10¹² sec-1 (for t ~ 10-12 sec),where  ~ 1031 gm/cm3 (Figure 14) even through particles are restmass-less before SSB/ESB, this data is still meaningful since E = m0c2/[1-(v/c)2]1/2, ~ 1031 gm/cm3 (Figure 14) even through particles are restmass-less before SSB/ESB, this data is still meaningful since E = m0c2/[1-(v/c)2]1/2,
and the gravitational constant G = 6.67x10⁻⁸ cm3/sec2-gm. Thus, the wash-out indicator k ~ 0.4 indicating that the system is in non-equilibrium state around the time frame of 10-12 sec. |
Figure 14 Cosmic History |
 E
E t
t 
 = 10-27 erg-sec, if the N neutrino were created soon after the epoch of
 |
Inflation at 10-33 sec (see Figure 15), then its mass M (in term of energy E) should not be lower than  /10-33, i.e., M /10-33, i.e., M  106 erg = 0.6x10⁹ Gev. Similar argument can also be applied to its decay product of anti-neutrino produced up to 10-12 sec around the SSB/ESB transition giving 106 erg = 0.6x10⁹ Gev. Similar argument can also be applied to its decay product of anti-neutrino produced up to 10-12 sec around the SSB/ESB transition givingMB-L  0.6x10⁻³ ev (most probably ~ 0.1 ev), which is compatible with experimental measurement. This is used as evidence to support the leptogensis theory. 0.6x10⁻³ ev (most probably ~ 0.1 ev), which is compatible with experimental measurement. This is used as evidence to support the leptogensis theory.
|
Figure 15 Early Universe |
 .
.
 = matter/radiation = 6x10⁻¹⁰. The present-day radiation number density = 411 cm-3 is interpreted as the result of matter/anti-matter annihilation leaving behind the baryonic number density ~ 2.5x10⁻⁷ cm-3.
 = (1/3)(nB-L/411) which yields nB-L =
  n0 = 7.5x10⁻⁷ cm-3.
 n0 = 7.5x1068 cm-3, and the radiation number density is 411x1075 cm-3.
 0 = 1054 gm/cm3.
 0 = 1065 gm/cm3 at that time, thus
  = 10-11 is required to account for the observed asymmetry by leptogenesis. The "B Meson Decay" experiments produce
  ~ 10-19 revealing that such CP violation mechanism is not sufficient.