

| Home Page | Overview | Site Map | Index | Appendix | Illustration | Preface | Contact | Update | FAQ |
|
|
or viruses), increasing the likelihood for uncontrolled cell division. More than 50% human tumors contain a mutation or deletion of the TP53 gene. Pharmacological research is on going to re-introduce p53 endogenously (by adenovirus) as a viable cancer treatment. China has approved such clinical treatment for the "head and neck squamous (scale-like) cell carcinoma" in 2003. |
Figure 21c1 p53 Pathway |
Figure 21c2 p53 Functions [view large image] |
 |
Why elephants do not get cancer is a famous conundrum that was posed in the 1970s (Figure 21c3). Scientists were bewildered as to why they don't get the disease despite having 100 times as many cells as humans and hence about 100 times more chance. Two independent researches have revealed in 2015 that their chromosome carry 20 copies of the P53 gene while human has only one. They have a more robust mechanism for killing damaged cells that are at risk for becoming cancerous. It remains to be checked out if other massive animals such as whales also possess more copies of this P53 gene. See "How elephants avoid cancer" in Nature, 08 October 2105. |
Figure 21c3 Extra P53 Copies in Elephant [view large image] |
 |
too much of the good thing becomes lethal causing death. Mice with too much of p53 die within one day owing to unchecked cell death in the brain and severe neurological defects. On the other hand, mice lacking p53 gene die within two weeks of birth. It has been discovered in 2016 that there is a tightly controlled system to regulate the activity of p53. As shown in Figure 21c4 at time of cell stress, acetyl group (Ac, acetylation) are added to the CTD domain of p53 allowing it to target the DNA (via the CBT or p300 protein). The subsequent gene transcription would influence the cell fate (cell cycle arrest, DNA repari or cell suicide). In case there is no stress, the SET protein would bind to the CTD removing the intermediate link via the CBT or p300 so that no transcription is processed and no harm is done to the cell. |
Figure 21c4 p53 Shield |
See original article : "Acidic Shield Puts a Chink in p53's Armour". |
 |
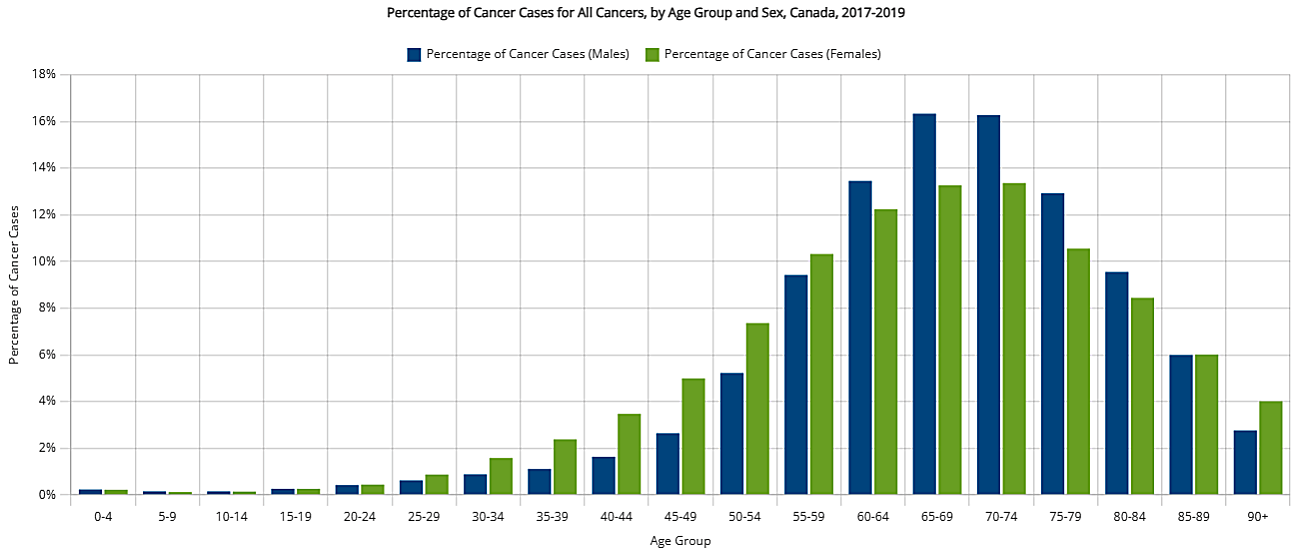
Everyone has a chance of harboring precancerous cells. Thank to the numerous checkpoints within the cell, only about 2.5% of Canadians had been diagnosed with cancer in the previous 10 years (according to a 2009 survey). Based on 2006-2008 estimates, 63% of Canadians diagnosed with cancer are expected to survive for 5 years or more after a cancer diagnosis. Grading of the disease depends on whether the cells are differentiated (low grade) or undifferentiated (high grade = severe) as depicted roughly in Figure 21d2. |
Figure 21d1 Cancer |
Figure 21d1 shows the cancer cells under microscope (a) and through speculum (b). Some of the differences between normal cell and tumor are shown in Figure 21d2 and Table 05b below. |
 |
| ||||||||||||||||||||||||
Figure 21d2 Normal Cell vs Tumor [view large image] |
Table 05b Normal Cell vs Tumor |
 |
A 2016 research report indicates that some cancer cells avoid this fate through a mechanism called "Alternative Lengthening of Telomeres" (ALT). The process is summarized in Figure 21d3 : (a) Shortening of telomere in normal cell division. (b) The cancer cell produces a protein complex RFC1-5 and binds it to the break. (c) The RFC1-5 recruits more enzymes to replicate the telomere from a template. |
Figure 21d3 Telomere Lengthening |
The discovery may lead to future therapies to kill cancer cells by targeting the ALT. See "DNA repair: Telomere-lengthening mechanism ". |
 |
Cancer cells start early to metastasize by entering circulatory system long before a tumor is diagnosed. These circulating tumour cells (CTCs) seldom survive due to immune resistance. However, few of them may evade suppression and stay in niches to re-activate again in favorable condition. Figure 21e1 depicts the various events leading to overt colonization. The relapse can occur in distant site and the latency can last from months to decades. Details of the process can be found in the original article "Metastatic Colonization by Circulating Tumour Cell" in Nature, 21 January 2016. The long article is summarized in a few steps below : |
Figure 21e1 Metastatsis |
 |
|
Figure 21e2 Extracellular Matrix [view large image] |
 |
|
Figure 21e3 Metastatic Niches [view large image] |
 |
|
Figure 21e4 Metastatic Growth Signaling [view large image] |
 |
organ site. Treatments include classic chemotherapy, targeted therapy against oncogenic drivers, immunotherapeutic agents that leverage the antitumour power of the immune system and, increasingly, a combination of all of these. Treatments that target metastasis in a particular organ - by taking aim at cancer-cell interactions with the host tissue - would be indicated when metastasis is confined to that organ, as is the case with bone metastasis in some people with breast cancer. Therapies frequently achieve only partial tumour shrinkage and leave behind substantial amounts of malignant cells. Continued treatment can keep the residual tumour indolent for some time. However, drug-resistant cancer-cell clones eventually emerge that drive rapid relapse. As a result, the cure rates of patients with metastasis remain disappointingly low (Figure 21e5). |
Figure 21e5 Metastasis, Therapy [view large image] |
 |
The ultimate cause for cancer is the failure of cellular control on the growth and development. The problems could be genetic (5-10%) or environmental as shown in Figure 21f. The genetic (hereditary) cause can be further classified by occurrence in different organs together with family risk ratio. There are many environmental causes, each one is labeled by its percentage contribution. BTW, the risk ratio R is defined by the formula R = (SE/NE)/(SC/NC), where S stands for number of occurrences, N for the number of participants; the subscripts E and C denote the experimental and control group respectively. For the special case of NE = NC , R = SE/SC . The experimental (clinical trail) group in Figure 21f is the family members with history of particular cancer. |
Figure 21f Causes of Cancer |
The various causes are under slightly different headings according to different literatures. The following list should cover most of them. |
 |
 |
|
Figure 21g TP53 Hereditary Defect [view large image] |
Figure 21h BRCA1 Hereditary Defect |
|
 |
(1) duration of contact, (2) frequency, (3) when, (4) how, and (5) individual's susceptibility. The U.S. Department of Health and Human Services maintains a "Report on Carcinogens (RoC)" containing hundreds (243 by 2014) hazardous substances (not all of them are chemicals). Examples for some chemical carcinogens are listed in Table 05c below. Most of the entries are in the category of "Known to be Carcinogenic" except Chloroform, which is classified as "Reasonably Anticipated". |
Figure 21i Chemical Causes [view large image] |
BTW, carcinogens are cancer causing substances. Their harmful effects may not be immediate, thus they can be rather insidious. |
| Carcinogen | Sites | Sources |
|---|---|---|
| Arsenic | Lung, bladder, liver, kidney | Smelting, alloys, electrical devices, herbicides, fungicides |
| Asbestos | Lung, gastrointestinal tract | Used to be in : roofing, floor tiles, brake linings, textiles |
| Benzene | Leukemia, Hodgkin lymphoma | Diesel, printing, paint, (formerly as solvent and fumigant) |
| Berylium | Lung | Missile fuel, alloys |
| Chloroform | Rectum, bladder, (kidney, liver in animals) | Solvent, reagent, anesthetic, chlorination, pulp/paper mills, waste sites. |
| Vinyl Chloride | Liver, brain, lungs, blood, hermangiosarcoma (blood vessel in dog) | PVC plastic, vinyl products |
 |
|
Figure 21j Cancers by Infections |
 |
Some cases result in skin warts, and rarely it becomes cancerous with very slow progression in interval of 10 - 30 years. The high-risk infection is a cause for nearly all cases of cervical cancer (Figure 21k). Vaccines has been developed for immunization against the infection. In Canada females 9 through 26 years of age are recommended to take either Gardasil by Merck or Cervarix by GSK. The immunization programs soon ran into controversies as the church equated it to encouragement of early sex, the pharmaceuticals were accused of conspiracy in selling unproven proudcts, and there were rumors about adverse side effects including Multiple Sclerosis (MS) and even death. |
Figure 21k HPV Infection [view large image] |
 |
|
Figure 21l Virus Lifecycle [view large image] |
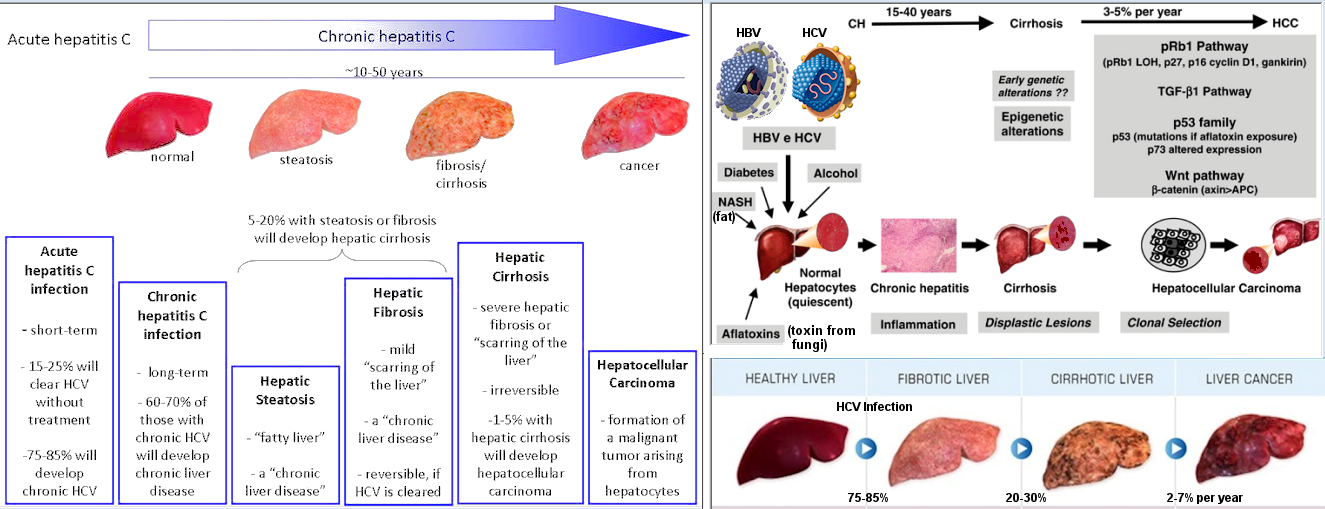 |
to humans" in the "Report on Carcinogens (RoC)" . While papillomvirus causes tumor in the cervix, HCV and HBV induce cancer in the liver called Hepatocellular Carcinoma (HCC). The virus infection accounts for about 80% of the HCC, which causes 735000 deaths in 2013. The slow development goes through many stages as shown in Figure 21m and summarized below. |
Figure 21m HCV/HBV Infections [view large image] |
 |
increased risk for Gastric (stomach) cancer (GC). This kind of data mostly came from statistical observations, e.g., more GC cases from individuals infected with H. pylori. It is only recently in the 21st century that some models were proposed to account for the cancer causing mechanisms. |
Figure 21n H. pylori Infection [view large image] |
One theory proposes that GC is developed via the interaction between H. pylori and the host genetic susceptibility as explained in the following summary (see Figure 21n). |
 |
 |
qualified by emphasizing that the particles have to be at high energy ( Mev) and the waves do not depend on a medium (such as the electromagnetic waves, not sound wave which depends on a medium such as air). Thus, radiation is distinct from the energy transfer processes of conduction and convection. Mev) and the waves do not depend on a medium (such as the electromagnetic waves, not sound wave which depends on a medium such as air). Thus, radiation is distinct from the energy transfer processes of conduction and convection.
|
Figure 21o Sources of Radiation [view large image] |
Figure 21p Cancer by Radiation |
 |
As shown in Figures 21o 21p and 21q, radiation can be classified into non-ionizing and ionizing. The dividing line is about 50 ev (Figure 21q), beyond which the radiation will break up cellular structure such as DNA; while the damage is from the generation of reactive chemical by the non-ionizing radiation (Figure 21p). The problem with exposure to a single radiation is minimal whether it is the high or low energy variety. The cell has mechanism (such as committing suicide as directed by the p53 protein) to deal with that. It is the does in term of energy per unit mass or unit volume or unit area that inflicts the damage according to the the amount and duration of exposure. The following is a brief description for these two kinds of radiation. |
Figure 21q Radiation Energy |
 |
|
Figure 21r Non-ionizing Radiation [view large image] |
out that reflection plays a dominant role in this case. Thus, UVB (the one with higher energy) would do damage only down to the basal layer while UVA goes deeper into the dermis. |
 |
The intensity (dose) of UV radiation is measured in the units of milliwatts per cm2 (mW/cm2). Canadian scientists invented the UV index from the typical dose of 250 mW/m2 in midday summer sunlight (the highest dose in Canada) by dividing 25 mW/m2 to generate a convenient range for the UV index with a scale of 0 to 11 (see table 05d). It is now broadcasted daily in Canada as part of the weather forecasts. |
Table 05d UV Index [view large image] |
 |
 |
|
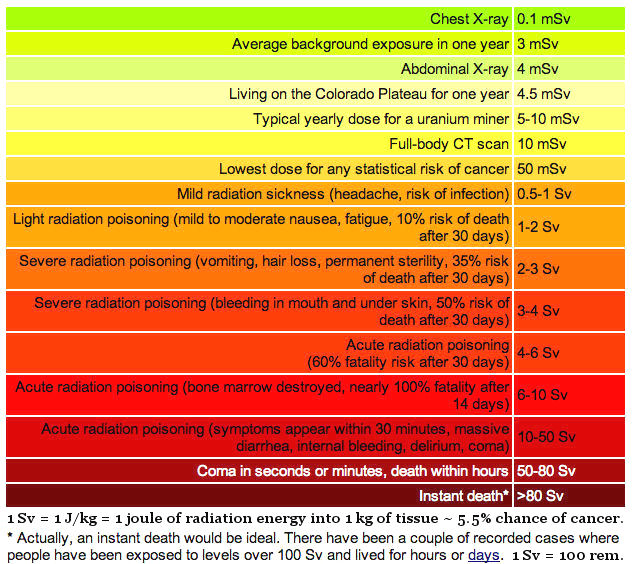
Figure 21sa Ionizing Radiation |
Figure 21sb Annual Radiation Exposure [view large image] |
 |
cancer. It is found that the poisons can weaken the body's cancer suppression mechanism allowing the cancerous cells to grow out of control. Smoking can cause cancer almost anywhere in the body, but most often occurs in the upper respiratory tract - the smoke's thoroughfare. The poisons eventually congregate inside the lung where 9 out of 10 cancers are caused by smoking cigarettes. |
Figure 21t Cancer by Smoking [view large image] |
 |
|
Figure 21u Cancer by Alcohol |
As shown in Figure 21u, the carcinomatous sites are mostly along the digestive tract, where the alcoholic drink passes through. See "The Effects of Alcohol and Alcoholism on Your Health" for impacts on the other organs. |
 |
at the end add a methyl group to the DNA (called methylation), or RNA, or proteins. The addition has a profound effect on gene expression, the deficiency of which often leads to cancer. Some of the foods for enhancement of methylation are shown in Figure 21u. The soybean also serves to increase the activity of the P53 - the tumor suppression gene. |
Figure 21v Methylation of DNA [view large image] |
In this image, SAM stands for S-Adenosyl methionine, which is a common cosubstrate (cofactor, helper molecule) involved in methyl group transfers, transsulfuration, and aminopropylation. |
30 is considered to be obese. This is a rich man's disease as shown in the world obesity map. Several possible mechanisms have been proposed to explain the association of obesity with increased risk of certain cancers (see below and Figure 21w). |
|
Figure 21w Cancer by Obesity |
 |
The flip side of the cause is prevention. It is the practice of avoiding those causes that lead to the development of cancer. The Mayo Clinic puts it into 7 tips :
|
Figure 21wb List of Risks |
Figure 21wb summerizes some of the risks, real and imagined. Two more popular misconceptions about harmful substances : (1) Genetically Modified (GM) foods, (2) Drinking from plastic bottles. |
 |
There is no single marker that indicates the occurrence of cancer. In general, please take note when you feel something abnormal in your body (symptom) or an unusual appearance is detected (sign). A single signal (symptom or sign) by itself may not mean anything serious. However, please check it out with your doctor if many signals happen simultaneously and last for a long time or get worse. Cancer is easier to cure when it is treated earlier. The signs and symptoms in the followings (and in Figure 21x) are just a rough guide. Don't be over alarming, sometimes the mere thought of having cancer is enough to wreak havoc with one's health. |
Figure 21x Signs and Symptoms of Cancer [view large image] |
 |
To address the lagging doubt about the symptoms, it is advisable to run a diagnosis to determine the cause. There are many types from body fluid testing, image scanning, to the more invasive biopsy. The test usually tries to detect some molecular markers shedding off the tumor cells or by examining the lump directly. The diagnostic tools can be summarized into three categories as shown in the followings (also see Figure 21x1). |
Figure 21x1 Cancer Diagnoses |
 |
Some scanning techniques depend on different affinity of the organ to radioactive material to become the source of emission from within. Regardless of the methods, the test requires skillful technician (radiologist) to detect the tumor by its abnormal disposition or by comparison with previous image (for recurrence). Figure 21x2 shows two images produced by two different type of scanning machines. The lumpy growth is apparent by its size, while tiny spot in recurrence is more difficult to detect. There are several techniques as listed in the followings. |
Figure 21x2 Image Scanning |
 |
|
Figure 21x3 |
 |
The discovery that parts of tumour cell, or even a whole cell, break away from the original site and enter the bloodstream led to the idea of liquid biopsies. With this approach, cancers can be genetically characterized by analyzing tumour DNA taken from a blood sample, thus bypassing the need to extract solid tumour tissue. The biopsy becomes a type of blood test albeit more sophisticated. It is the rapid rise of genome-sequencing techniques that has made it practical to translate the concept to the clinic. Information about the sample can be obtained from the tumour cell, its DNA, the exosome, or even the platelets (Figure 21x4). Researchers suggest that it is no longer a question of whether liquid biopsies will one day replace surgical biopsies, but when and in what form. This technique may have a problem with locating the tumour. |
Figure 21x4 Liquid Biopsy |
 |
There are many types of cancer treatment. Some of them are invasive while the others may entail adverse side effects. Figure 21y shows the 5 years survival rate after diagnosis (and following up with treatment). Some types of cancer such as the one in the prostate has excellent chance of about 100% since it mostly occurs in very old age and is usually harmless. While the pancreatic cancer is the most lethal with only about 5% survival rate. This type of cancer typically spreads rapidly and is seldom detected in its early stages. As shown in Figure 21y (the percentage within brackets), the survival rate drops rapidly once the cancer has metastasized. |
Figure 21y Cancer Survival Rate |
 |
 |
This form of treatment is most suitable when the cancer is contained in one area. The lofty goal is the complete removal of the cancer without damage to the rest of the body - a miracle that is seldom achieved. |
Figure 21za Lobectomy, Mastectomy [view large image] |
Figure 21zb Colectomy, Nephrectomy |
 |
|
Figure 21zc Modern Surgical Techniques [view large image] |
 |
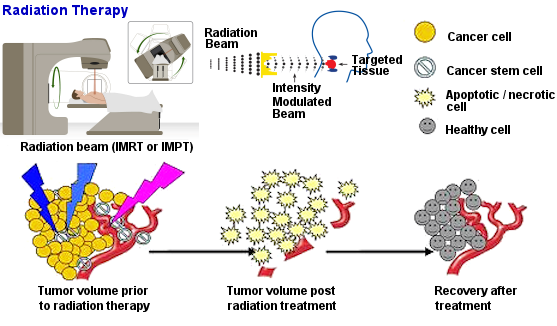
This is shown schematically in Figure 21zd where IMRT stands for Intensity Modulated (controlled) Radiation Therapy, while the "P" in IMPT denotes the use of high energy "Particle" instead of "Radiation". Actually, the radiation dose (in unit of Gy = J/kg) is limited by the radiation tolerance of the various organs. Table 05e lists the tolerance dose to an organ based on giving the dose in one fraction or fractionated, using TD5/5 (5% chance of injury showing up over the next 5 years) and TD50/5 (50% chance of an injury in next 5 years). |
Table 05e Parameters of Radiation Therapy : Tolerance Doses (TD5/5 - TD50/5) |
 |
Radio-sensitivity is defined as the does required to kill the tumor. While the cancer cells in leukemias and lymphomas can be eliminated rapidly by radiation, killing of epithelial cancers need a moderate does (60 - 70 Gy) to be effective. Renal cancer and melanoma are radio-resistant, radiation therapy is just a palliative option (not intended to cure, but only for the lessening of suffering) for terminally ill patients. Since large size tumor does not respond well to radiation therapy, surgery or chemotherapy is often performed prior to the radiation treatment. |
Figure 21zd Radiation Therapy |
Radiation "curability" is not exactly the same as radio-sensitivity. For example, leukemias are not curable with radiation therapy because the cancerous cells spread all over the body, while lymphoma is basically curable if it is localized to one area of the body. |
 |
Another problem with chemotherapy is the indiscriminate killing of all actively dividing cells whether they are normal or cancerous. However as shown in Figure 21ze, the killing effect on normal cells requires higher dose and thus creates a safety window within which more than 50% of the normal cells would survive while up to 80% cancerous cells may be eliminated. Targeted therapies use relatively new class of drugs to target certain special features in the tumor. These kinds of drug are cancer type specific, or even on patient specific basis. Therapeutic dosage depends on the kind of drug and body specific parameter such as metabolic mass or body weight. For many clinical purposes a more suitable indicator is the Body Surface Area (BSA) defined by BSA (in m2) = [(height in cm)x(weight in kg)/3600]1/2 (see "Chemotherapeutic Agents and Their Uses, Dosages, and Toxicities" about the determination of dosage for different kinds of drug). |
Figure 21ze Chemotherapy |
The choice for specific drug depends on : (1) type of cancer, (2) stage of the cancer, (3) patient's health. Most chemotherapy is delivered intravenously, about 10% is given orally (Figure 21ze). |
 |
|
Figure 21zf Other Cancer Treatments [view large image] |


 see "p53 protein"
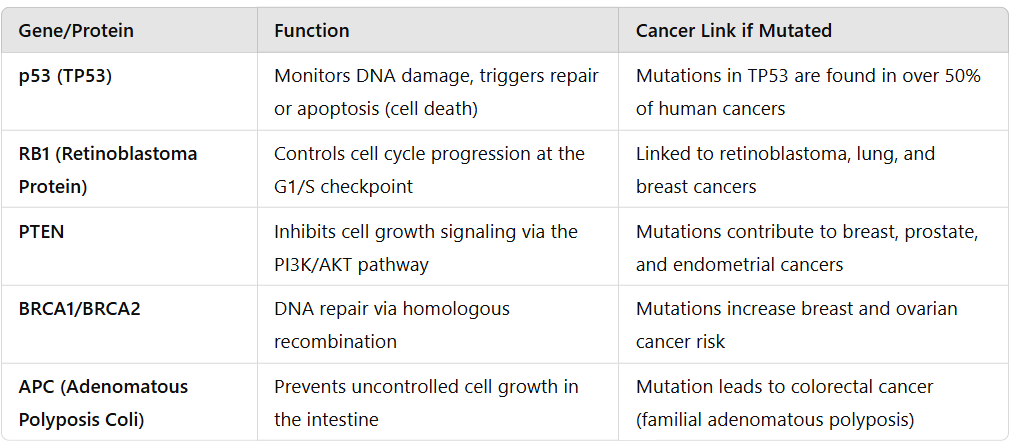


