
 t
t  E >
E >  allows virtual particles (each kind corresponding to a specific quantum field) continually materialize out of the vacuum for a short time and then vanish according to the uncertainty principle (Figure 05p).
| Home Page | Overview | Site Map | Index | Appendix | Illustration | About | Contact | Update | FAQ |
 |
In classical physics, empty space is called the vacuum. The classical vacuum is utterly featureless. However, in quantum theory, the vacuum is a much more complex entity. The uncertainty principle  t t  E > E >  allows virtual particles (each kind corresponding to a specific quantum field) continually materialize out of the vacuum for a short time and then vanish according to the uncertainty principle (Figure 05p). allows virtual particles (each kind corresponding to a specific quantum field) continually materialize out of the vacuum for a short time and then vanish according to the uncertainty principle (Figure 05p).
|
Figure 05p Virtual Particle |
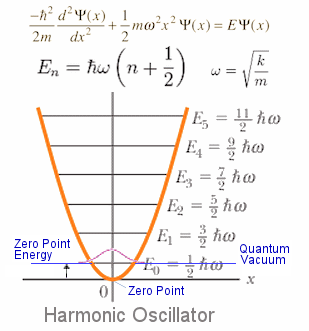 |
Such movement means that there is a lowest energy level for the virtual particles. The lowest part of the quantum fields at vacuum state can be approximated by a harmonic oscillator at each spatial point as shown in Figure 05q. The lowest energy level has an energy E0 =   /2 for n = 0 corresponding to no real particle according to "Quantum Field Theory" (QFT). Since there are an infinite number of harmonic oscillators per unit volume, the total zero-point energy density is, in fact, infinite. The process of renormalization is to move the zero point energy up to E0 so that En = n /2 for n = 0 corresponding to no real particle according to "Quantum Field Theory" (QFT). Since there are an infinite number of harmonic oscillators per unit volume, the total zero-point energy density is, in fact, infinite. The process of renormalization is to move the zero point energy up to E0 so that En = n  with n = 0, 1, 2, ... ; the infinity is thus removed. Such manipulation is justified by the fact that only the difference in energy is measurable. Now, the quantum vacuum is defined as no excitation of field quanta, i.e., no real particles are present. In other word, it is at a state of minimum (and zero) energy. The classical analogy would be a collection of motionless harmonic oscillators. with n = 0, 1, 2, ... ; the infinity is thus removed. Such manipulation is justified by the fact that only the difference in energy is measurable. Now, the quantum vacuum is defined as no excitation of field quanta, i.e., no real particles are present. In other word, it is at a state of minimum (and zero) energy. The classical analogy would be a collection of motionless harmonic oscillators.
|
Figure 05q Zero Point Energy [view large image] |
 dictates a minimum spatial size in which only one fermion is admissible such that a
  b. The ultimate minimum has to be a cube with the Planck length Lpl = 1.62x10⁻³³ cm on each side.
 |
 and a, i.e., the Hamiltonian can be expressed as H = h and a, i.e., the Hamiltonian can be expressed as H = h (a (a a + 1/2) without referring to the mass (see "Harmonic Oscillators and Quantization of Field"). This form is more suitable in the present context as the quantum fields are supposed to be massless, its corresponding particle acquires mass only when excited and interacting with the Higgs field. Indeed, all the particles gained their respective mass only after the Electro-weak Era some 10-11 sec after the Big Bang (see "Higgs Field Interaction"). a + 1/2) without referring to the mass (see "Harmonic Oscillators and Quantization of Field"). This form is more suitable in the present context as the quantum fields are supposed to be massless, its corresponding particle acquires mass only when excited and interacting with the Higgs field. Indeed, all the particles gained their respective mass only after the Electro-weak Era some 10-11 sec after the Big Bang (see "Higgs Field Interaction"). |
Figure 05r Quantum Fields [view large image] |
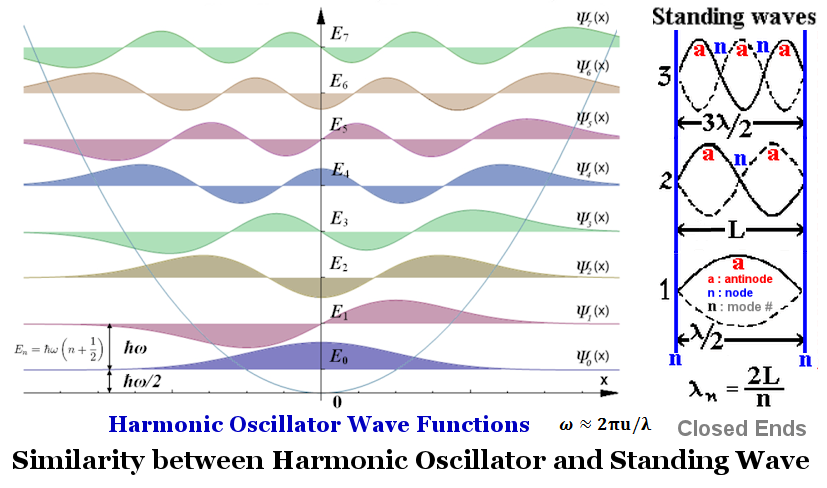
Ek = (1/2)h  k. Thus, the vacuum energy density is k. Thus, the vacuum energy density is  k = Ek / (Lpl)3, where different type of fermion would have its specific frequency k = Ek / (Lpl)3, where different type of fermion would have its specific frequency  k. k. |
 |

|
Figure 05s Normal Modes |
This is the so-called "Vacuum Catastrophe". The problem can be solved by noting that contribution from the higher mode is smaller by shorter time fluctuation of the amount  t ~ t ~  / /  E according to the uncertainty principle. E according to the uncertainty principle. |

 |
|
Figure 05t Casimir Effect [view large image] |
It is estimated that for a gap d ~ 10-5 cm, the energy in between E ~  c/d ~ 10-12 ergs. The number of zero point quanta N ~ (10-5 x 1)/(Lpl)3 ~ 1094 for 1 cm2 plates. Then the energy contains in one quanta E c/d ~ 10-12 ergs. The number of zero point quanta N ~ (10-5 x 1)/(Lpl)3 ~ 1094 for 1 cm2 plates. Then the energy contains in one quanta E ~ 10-106 ergs - a rather surprising agreement in magnitude by such crude estimate with the theoretical estimate above. ~ 10-106 ergs - a rather surprising agreement in magnitude by such crude estimate with the theoretical estimate above. |
 |
The dominance of dark energy over matter occurred at about 7 billion years since the Big Bang according to some astronomical observations. It is found that only constant dark energy density or a very slowly varying one in standard cosmology can reproduce a rough match for this value of transitional time. All other forms proportional to 1/Rk (R is the scale factor) would fail the test (Figure 05u). The range of k that can produce a viable cross-over time is shown in the table below : |
Figure 05u Dark Energy Era [view large image] |
We are going to use the standard cosmological equation with the additional 1/Rk dependence on the cosmological "constant" term (time in unit of 1/H0), i.e., |
 |
(dR/dt)2/R2 =  m/R3 + m/R3 +   /Rk, which can be recast to express the cosmic acceleration explicitly /Rk, which can be recast to express the cosmic acceleration explicitly  (d2R/dt2) = R[-  m/(2R3) + (1-k/2) m/(2R3) + (1-k/2)  /Rk] = 0 at cross-over time; then the scale factor /Rk] = 0 at cross-over time; then the scale factorR = eq/(3-k), where q = ln(  m) - ln[(2-k) m) - ln[(2-k)  ], with ], with  m = 0.26, m = 0.26,   = 0.74; giving the red shift = 0.74; giving the red shiftz = (1-R)/R, while the cross-over time since Big Bang in Gyr (109 years) T is computed by a Cosmic Calculator with the above parameters and 1/H0 = 13.7 Gyr (or H0 = 71.4 km/s-Mpc). |
 |
cycle. For example, in the current cycle where we happen to live in, the energy density of the false vacuum is about 10119 ergs/cm3. Such energy has been converted to various entities since then. The true vacuum has attained its current value of about 10-8 ergs/cm3 since the beginning of this cycle. Therefore, the calculated vacuum energy density of 10127 ergs/cm3 is not the dark energy, it is instead the energy released into this cycle of the universe (Figure 05v,b). This kind of consideration can be applied to |
Figure 05v Dark Energy in Cyclic Universe [view large image] |
other cosmological theory in general (such as the inflation theory) with the false vacuum energy density coming from some source. |
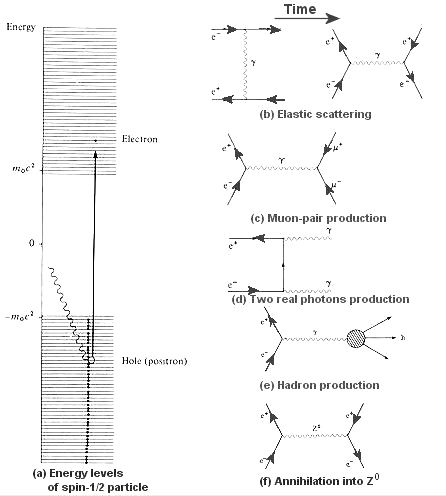 |
Another kind of vacuum structure is prescribed by the Dirac theory of spin-1/2 particles in 1930. It admits the existence of both positive- and negative-energy particles: E =  (m02c4 + p2c2)1/2. The concept of negative-energy entities is wholly alien to our knowledge of the universe. All things of physical significance are associated with varying amounts of positive energy. To get around the problem, Dirac proposed an energy spectrum containing all electrons in the universe (see Figure 06a). In addition to the normal positive-energy spectrum, it also contains the negative-energy variety, which spans the spectrum from -m0c2 down to negative infinity. All the negative-energy levels are filled, thus the positive-energy particle is inhibited from transition into these lower energy states. Thus, there is no observable effect in the real world. Only when there is enough energy available, e.g., E (m02c4 + p2c2)1/2. The concept of negative-energy entities is wholly alien to our knowledge of the universe. All things of physical significance are associated with varying amounts of positive energy. To get around the problem, Dirac proposed an energy spectrum containing all electrons in the universe (see Figure 06a). In addition to the normal positive-energy spectrum, it also contains the negative-energy variety, which spans the spectrum from -m0c2 down to negative infinity. All the negative-energy levels are filled, thus the positive-energy particle is inhibited from transition into these lower energy states. Thus, there is no observable effect in the real world. Only when there is enough energy available, e.g., E  2m0c2, a real particle and anti-particle pair with positive-energy can be created from this unseen sea of negative-energy particles. The particle is 2m0c2, a real particle and anti-particle pair with positive-energy can be created from this unseen sea of negative-energy particles. The particle is
|
Figure 06a Negative Energy [view large image] |
the electron originally resided in the negative energy region, while the anti-particle (positron) can be interpreted as the hole in the vacated energy level acquiring a mass m0. The law of charge conservation demands that this anti-particle carries a positive charge. |
 +
+ - as shown in diagram (c), Figure 06a. The single photon must be virtual (off-shell) as it does not obey energy-momentum conservation.
 +s should emerge in one hemisphere than in the other (with the reverse asymmetry for the
  -s). Such parity violation was duly confirmed in 1981.
 hadrons to that for e+e-
 +
+ -, as a function of the colliding energy:
 | ---------- (45) |
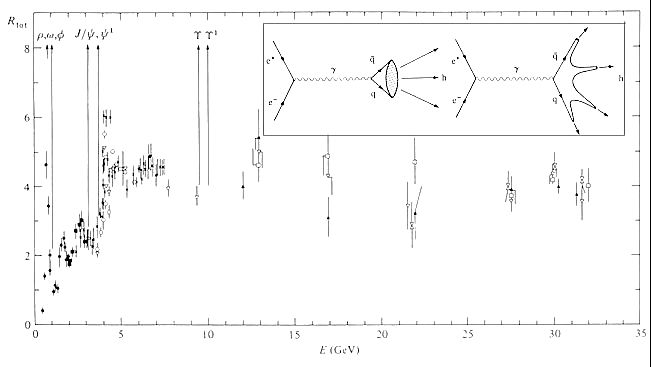 |
Closer examination of diagram (e), Figure 06a reveals that the intermediate product is a pair of quarks as shown in the insert within Figure 06b. The quark confinement process creates the observed hadrons in the final state. As the quarks are observed to be point-like (in deep inelastic scattering) and spin 1/2, the intermediate process e+e-  q q is very similar to the process e+e- is very similar to the process e+e-   + + -, the only difference being that the charges on the quarks are only some fractions of that on the muons. This explains the constancy of the ratio R mentioned earlier and displayed in Figure 06b. As for the pronounced spikes -, the only difference being that the charges on the quarks are only some fractions of that on the muons. This explains the constancy of the ratio R mentioned earlier and displayed in Figure 06b. As for the pronounced spikes
|
Figure 06b Reaction Ratio [view large image] |
which punctuate the curve in Figure 06b. These shapes are formed at certain energies of the e+e- collision, when the q pair have just the correct mass to appear as a single-meson resonance. They are the SU(3) flavour symmetry mesons with mass ~ 1 Gev. pair have just the correct mass to appear as a single-meson resonance. They are the SU(3) flavour symmetry mesons with mass ~ 1 Gev. |
 |
the c mesons form a spectrum from the different values for the spin and the orbital angular momentum of the constituent quarks as shown in Figure 06c. In the same notation for the atomic spectra, S, P and D in the diagram refer respectively to orbital angular momentum 0, mesons form a spectrum from the different values for the spin and the orbital angular momentum of the constituent quarks as shown in Figure 06c. In the same notation for the atomic spectra, S, P and D in the diagram refer respectively to orbital angular momentum 0,  , and 2 , and 2 . The resemblance to the atomic spectrum is understandable because of asymptotic freedom as the c and . The resemblance to the atomic spectrum is understandable because of asymptotic freedom as the c and  bound themselves together loosely. The force between the quarks can be formulated as a potential acting in the vicinity of a colour charge. Thus instead of the Coulomb potential in the case of the atom, the quarks interact via the potential: bound themselves together loosely. The force between the quarks can be formulated as a potential acting in the vicinity of a colour charge. Thus instead of the Coulomb potential in the case of the atom, the quarks interact via the potential:
|
Figure 06c [view large image] Meson Spectrum |
 s / (3r) + ar ,
 mesons provide direct support for the QCD picture of inter-quark forces containing both asymptotic freedom at short ranges and confining forces at longer distance. As the beam energy is increased, the quark and antiquark are produced with very large momenta, moving in opposite directions known as
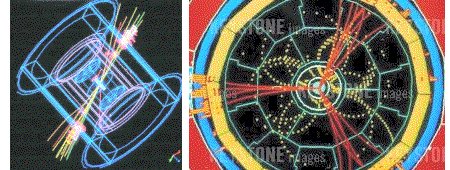 |
two-jet event. The fragmentation into hadrons then takes place, preferentially along the direction of the motion the quark and antiquark, resulting in jets of hadrons which become more and more collimated as energy is increased (see left diagram of Figure 06d). The measurement of the angular distribution of jet axes confirms that the spin of quarks is indeed 1/2. At even higher energy the quark or antiquark radiating a gluon, which forms a separate jet of its own. |
Figure 06d Two- and Three-Jet Event [view large image] |
This three-jet event is shown in the right diagram of Fgiure 06d. |
 =e2/c
=e2/c and related to the # of interaction points) with cross section (~ probability) about 1 barn (~ 10-24 cm2). For pair creation truly plucks out from vacuum, the process is fourth order
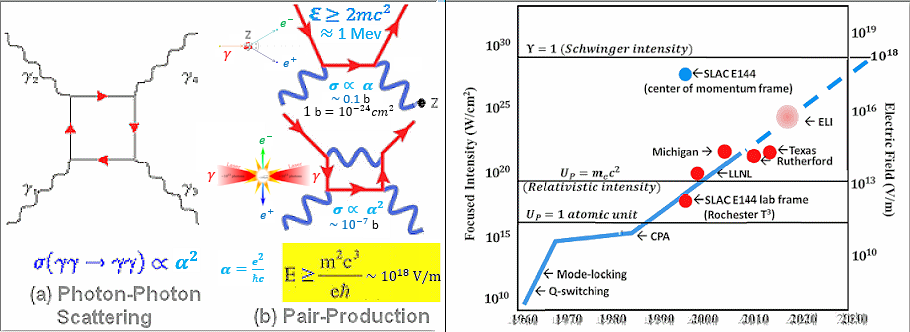 |
with a much smaller cross section ~ 10-7 b as shown in Figure 06e, in which, diagram (a) shows the photon-photon scattering when E < 2mc2. The process that produces the pair out of the vacuum requires very high photon intensity (such as very powerful laser not yet invented) to compensate for the much lower cross section. The diagram on the right shows the various laser facilities over the years. It predicts the laser capability could reach such requirement (the "Schwinger limit") by 2030. |
Figure 06e Schwinger Limit [view large image] |
See "What's inside nothing? This laser will rip it up to find out", New Scientist, January 26-February 1, 2019 for the world's most intense laser at ELI (Extreme Light Infra-structure) in Romania, 2019. |