
| Home Page | Overview | Site Map | Index | Appendix | Illustration | About | Contact | Update | FAQ |
|
|
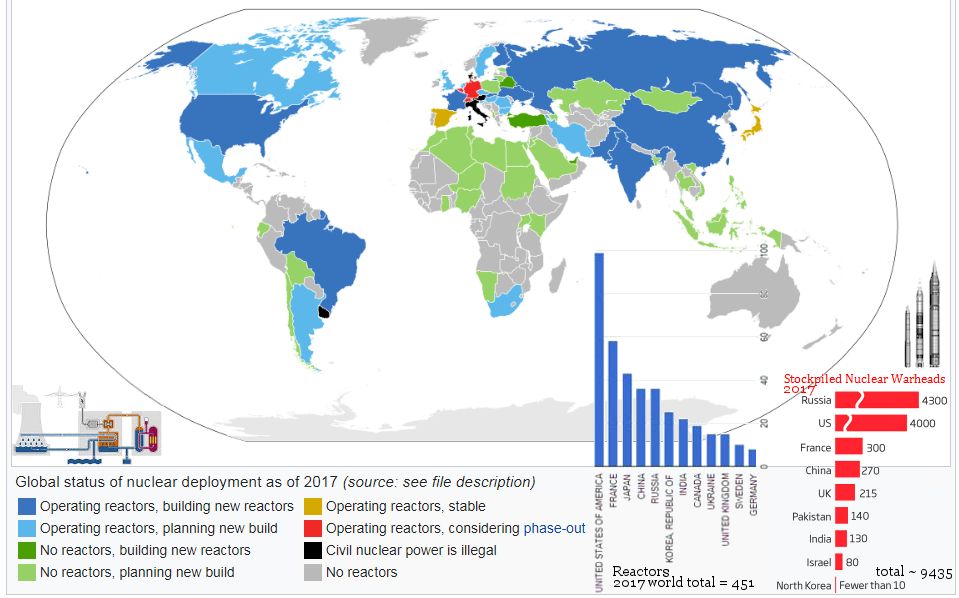
requires special treatment as they are carcinogenic and have a long half life, while most the other hazardous wastes disappear during that time frame. Usually, the fuel rod would be removed from the reactor in 18 - 36 months. The more troublesome waste is those left behind from the cold war era before 1991. Figure 14-21 shows the 2017 inventory of nuclear warheads, the total of which is 10 times the number of reactors already. At the peak of cold war madness, there were about 125,000 warheads produced by the US and Soviet Union - enough to destroy the world many times over. Such waste has become a real problem for its disposal. |
Figure 14-21 Nuclear Powers [view large image] |
Figure 14-22 Spent Fuel Composition |
See a list of the "US Weapons Production Sites" etc. |
 |
 |
gallons of hazardous liquid waste. It is called mixed waste because it contains both hazardous chemicals and radioactive materials. The cleanup effort is managed by the Department of Energy (DOE) with annual cost of 2 billion for another 20 years. As of 2017, the final goal of geological disposals has not been achieved. |
Figure 14-23 Hanford Site [view large image] |
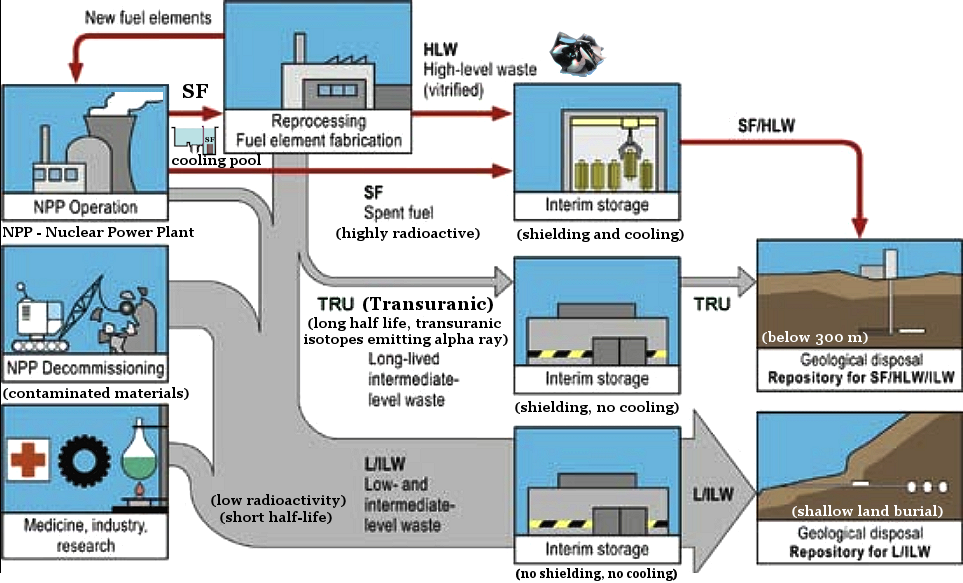
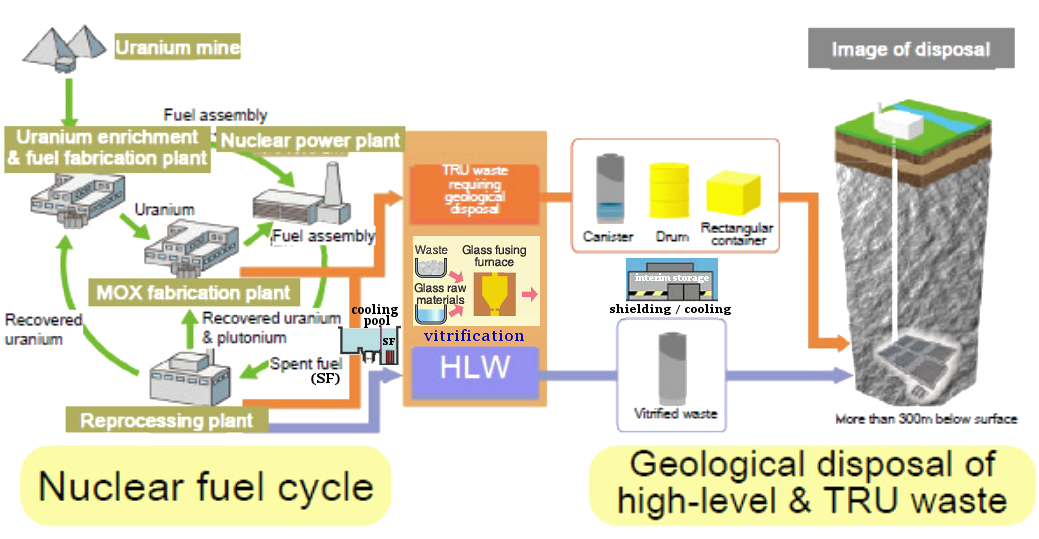
Figure 14-24 Fuel Cycle, Tow Views |
See "The Hanford Nuclear Site : A Legacy of Risk, Cost and Inefficiency" |
 |
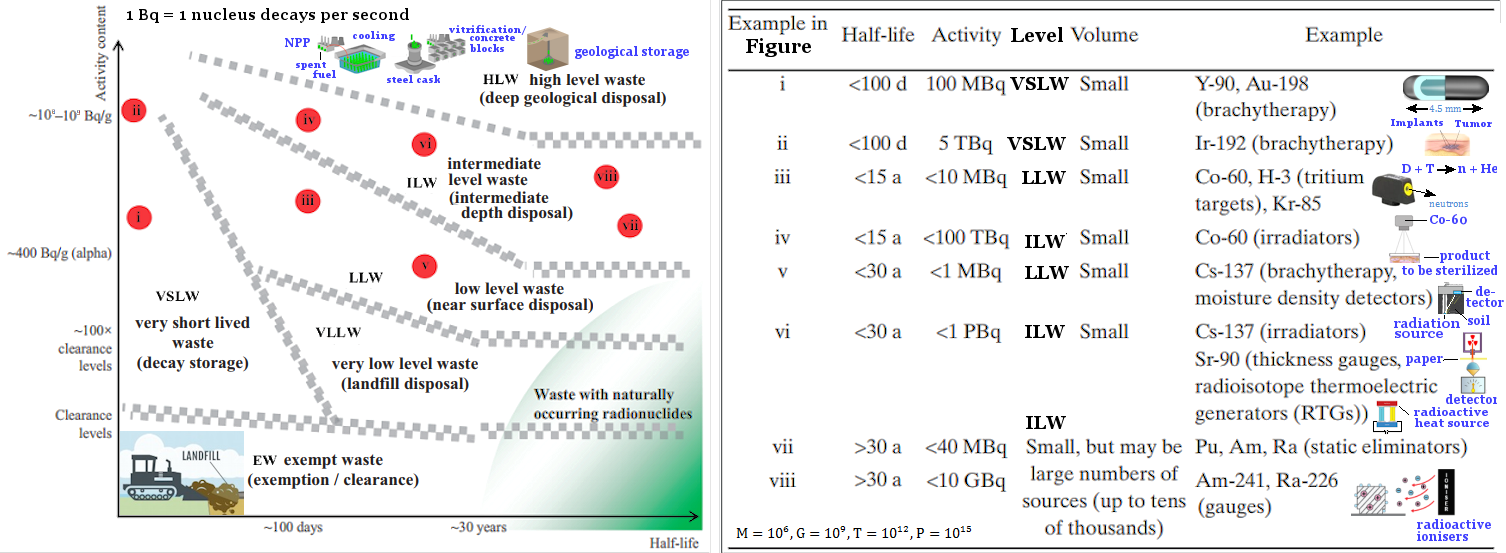 |
There are various schemes to separate contents of the nuclear waste into classes. In general, it is characterized by the waste's radioactivity, half-life, source, and method of disposal. Figure 14-25 shows one of those classification schemes. The International Atomic Energy Agency (IAEA) has provided a set of more comprehensive Safety Standards |
Figure 14-25 Classification [view large image] |
Figure 14-26 IAEA Classification |
which are summarized in the followings (also see Figure 14-26 for a visual review). |
 |
|
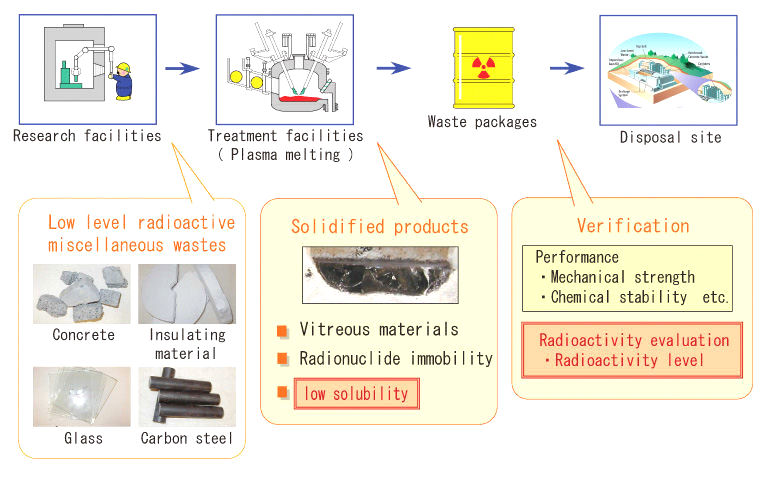
Figure 14-27 Low Level Waste (LLW) |
See "Plasma-Arc Vitrification of Waste", also "Waste in Glass". |
 |
|
Figure 14-28 High Level Waste (HLW) [view large image] |
 |
The decay mode of the radioactive isotope is closely related to the type of disposal of the waste. As shown in Figure 14-29 there is an optimal neutron to proton ratio for the existence of a stable nucleus. If a nucleus has too many neutron (high n/p ratio) the nucleus would undergo the beta decay process n  e via the weak interaction to reduce to ratio. On the other hand, the e- capture process (the reverse beta process) p + e e via the weak interaction to reduce to ratio. On the other hand, the e- capture process (the reverse beta process) p + e  e would bump up the ratio when it is too low. For heavy nucleus with Z > 82, the alpha decay through quantum tunnelling is the preferable mode to optimize the attractive strong interaction and the Coulomb repulsion. Gamma decay is the emission of high energy photons (see Table 14-05 below for more information about these decay modes). Table 14-06 is a list of radioactive isotopes from which the type of waste can be determined by the half life and decay mode. e would bump up the ratio when it is too low. For heavy nucleus with Z > 82, the alpha decay through quantum tunnelling is the preferable mode to optimize the attractive strong interaction and the Coulomb repulsion. Gamma decay is the emission of high energy photons (see Table 14-05 below for more information about these decay modes). Table 14-06 is a list of radioactive isotopes from which the type of waste can be determined by the half life and decay mode.
|
Figure 14-29 Nuclear Decay [view large image] |
 |
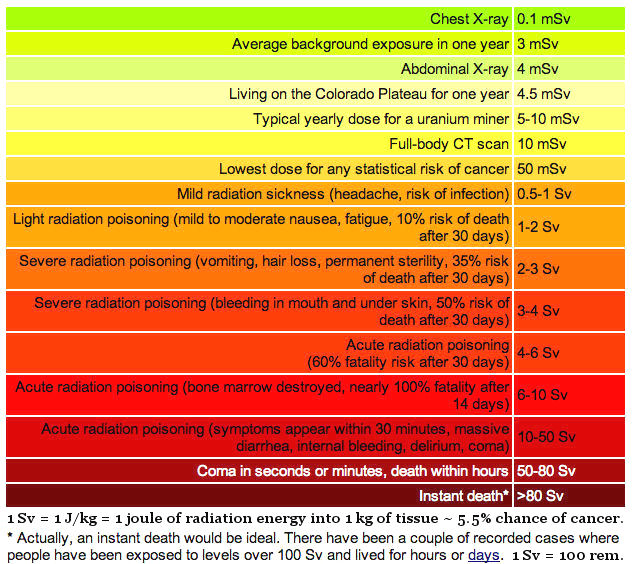 |
Table 14-05 Types of Decay Mode [view large image] |
Figure 14-30 Dosage Scale |
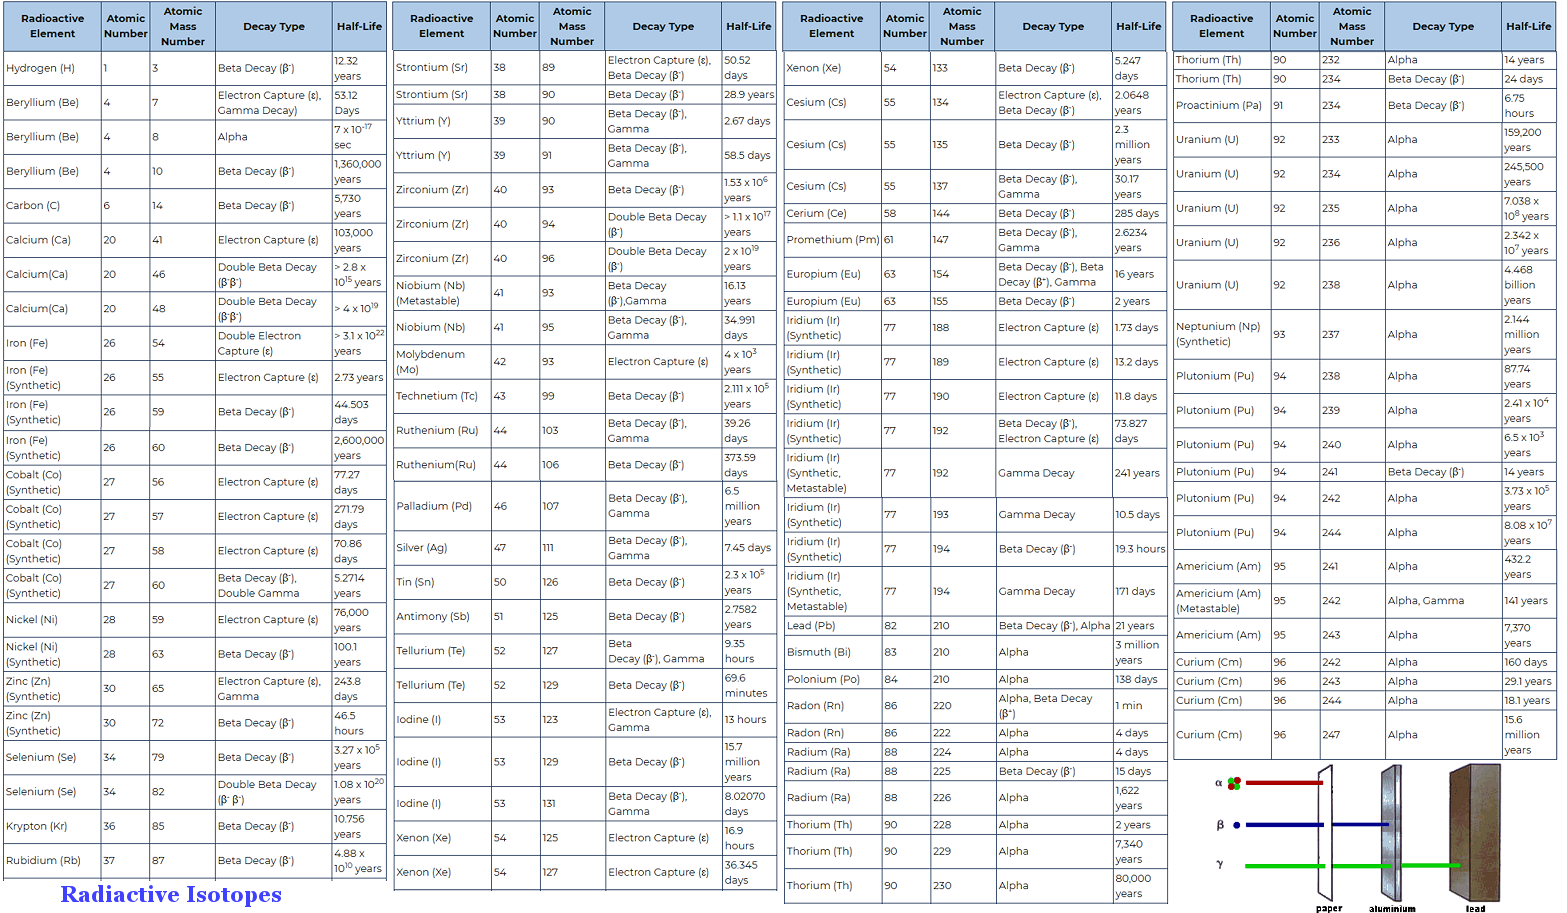 |
Table 14-06 List of Radioactive Isotopes (from ScienceStruck) [view large image] |
![[view large image]](I14-14-png.png)