 |
 |
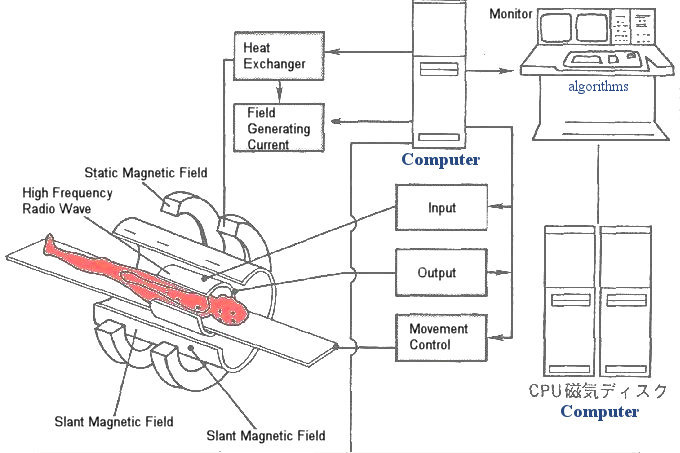
images (slices) of the tissue being examined. This method provides clearer and more detailed information than X rays used by themselves. CT scan also has the advantage of minimizing the amount of radiation exposure. Figure 1 is a schematic of the equipments with a rotating X rays source and detector. Before the scan is carried out, a contrast medium may be injected to make blood vessels, organs, or abnormalities show up more clearly; a drink of contrast medium may be given to highlight loops of intestine. The amount |
Figure 1 CT Scan |
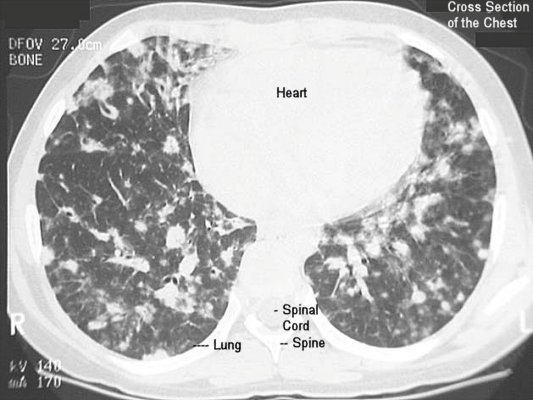
Figure 2 CT Image |
of X rays absorbed by different tissues is recorded by the detector and transformed by a computer into an image. Figure 2 shows a CT cross-section of the chest. |
The first CT scanner, which came into operation in 1972, was developed to study the brain. Since the, CT brain scanning has revolutionized the diagnosis and treatments of tumors, abscesses, and hemorrhages in the brain, as well as strokes and head injuries. It is also invaluable in investigating disease of any part of the trunk. It is particularly useful for locating and imaging tumors, and for facilitating needle biopsy (removal of a sample of tissue via a needle).
 |
 |
11, nitrogen 13, oxygen 15). These substances are injected into the blood-stream and are taken up in greater concentrations by areas of tissue that are more metabolically active. In the tissue, the substances emit positrons, which, in turn, release X-rays. It is the detection of these X-rays that actually forms the basis of PET scanning. By surrounding the patient with an array of detectors linked to a computer, the origin of the X-rays can be computed and a picture built of the distribution of the radio- active isotopes. Figure 4 is a sample of the PET brain scan. |
Figure 3 PET Scan |
Figure 4 PET Image |
PET scanning is particularly valuable for investigating the brain. It is used for detecting tumors, for locating the origin of epileptic activity within the brain, and for examining brain function in various mental illnesses. This technique has a serious drawback in that it requires an injection of radioactive marker. The dose is tiny but, for safety, no one person is generally allowed to have more than one scanning session a year.
 |
 |
detectable radio signal as they fall back into alignment. Magnetic field gradient is required to translates the signals into separate spatial locations. Magnetic coils in the machine detect these signals and a computer changes them into a cross-sectional or three dimensional image based on the strength of signal produced by different types of tissue. Tissues that contain a lot of hydrogen (such as fat) produce a bright image; those that contain little or no hydrogen (such as bone) appear dark. Figure 6 is a MRI image of the head. |
Figure 5 MRI Scan |
Figure 6 MRI Image [view large image] |
MRI provides clear images of tumors of the brain and spinal cord. Also shown clearly by MRI is the internal structure of the eye and ear. MRI can produces detailed images of the heart and major blood vessels, provides images of blood flow, and is useful for examining joints and soft tissues. Functional Magnetic Resonance Imaging (fMRI) is a technique for determining which parts of the brain are activated by different types of physical sensation or activity, such as sight, sound or the movement of a subject's fingers. This "brain mapping" is achieved by setting up an advanced MRI scanner in a special way so that the increased blood flow to the activated areas of the brain shows up on Functional MRI scans. fMRI is proving to be the most rewarding of scanning techniques, but it is phenomenally expensive. For this reason a lot of experimental work is still done by the older technique of PET.