Home Page Overview Site Map Index Appendix Illustration About Contact Update FAQ


Fluid Dynamics and the Navier-Stokes Equations


Spiral Flow (2009 version)

See the 2022 version.

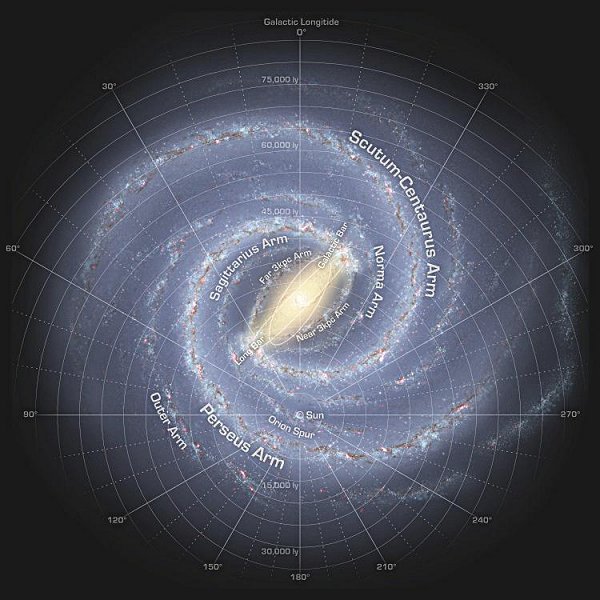
A spiral is usually developed when there is not enough force to oppose the inward movement. This kind of pattern includes phenomena such as spiral galaxy, hurricane, and drain in the sink (Figures 14, and 15). By neglecting the thickness of the spiral flow, Eq.(2) of the
Spiral Galaxy Spiral Hurricane Navier-Stokes Equations in cylindrical coordinates can be expressed as :
ur (ur/r) + u (ur/) = Fr ---------- (15a)
ur [(r u)/r] + u [(r u)/] = 0 ---------- (15b)
where u = /t. If we assumed further that the force acts on the fluid only in the radial direction, and the surface density is constant for the fluid, then

Figure 14 Spiral Galaxy

Figure 15 Hurricane
[view large image]

Eq.(1) of the continuity equation becomes:
(1/r) [(r ur)/r] + (1/r) [(r u)/] = 0 ---------- (16)
Archimedian Spiral A relationship between the velocity components is obtained by substituting Eq.(16) to
Eq.(15b):
ur = b u ---------- (17)
where b is a constant having the dimension of length. This formula can be integrated once more to yield:
r = a + b ---------- (18)

Figure 16 Archimedean Spiral [view large image]

where a is another constants of integration. Eq.(18) expresses the trajectory of an Archimedean spiral (see curve on the left of Figure 16). So far there is no restriction on whether the movement is to plunge inward or to expand.
    The appearance of the spiral is determined by the constants of integration:
  1. The value of b determines the winding of the spiral. As b = dr/d is the relative rate of change between r and , a small value of b makes the winding very tight and vice versa.
  2. The solution also admits another spiral arm with - or 180o out of phase (see curves on the right of Figure 16).
  3. With variation of orientation at r 0, the spiral assumes a broad sweeping pattern much like the hurricane in Figure 15 instead of one slim locus.
  4. The sign of b, i.e., b > 0 or b < 0, has the effect on the winding direction - whether it turns to the left or right.
  5. For the barred spiral like the Milkyway in Figure 14, the constant a > 0, while a = 0 is for the case of true spiral galaxy such as NGC2997. It turns out that the formation of spiral arms in galaxy is more complicated than this simple minded approach, which would produce tightly wound spirals (within 500 million years) in contrary to observation (see more in Theory of Spiral Arm Formation).
By substituting Eqs.(15b), (17) into Eq.(15a), it is found that the radial component of the velocity depends on r as:
ur2 / r = Fr ---------- (19a).
On the disk of the spiral galaxy Fr = GM / r2 + GM' / r2 - r2u2 / r
Rotation Curve with M to be the mass of the central black hole, while the mass on the disk within r is given by M' = 2 r dr, where = 0 (r0/r) is the surface density in unit of gm/cm2, 0 is its cutoff value at the edge of the galaxy r = r0, and the third term is the centrifugal force. Thus, the radial and rotational components of the velocity can be expressed as:
ur2 = GM / r + 2G0r0 - r2u2 ---------- (19b),
r2u2 = r (GM + 2G 0r0 r) / (b2 + r2) ---------- (19c),

Figure 17a Rotation Curve for Milky Way

which has the same profile of the rotation curve for the disk as shown in Figure 17a with a peak at rm (40r0b/M) b for 40r0b >> M. The observed curve takes into account of the dark matter in the halo.

According to the currently available data on the Milkyway:
2r020 1011Msun,
M 3x10⁶Msun,
r0 30 kpc,
rm 0.5 kpc,
the followings can be derived:
b 0.015 kpc, which implies tightly wound arms, and
(40r0b/M) 33 - enough to qualify for a peak in the rotation curve.
The calculated rotation and radial velocities at r0 are: r0 u 122 km/sec, and ur 0.06 km/sec respectively.
At the event horizon of the central black hole rs 2GM/c2 matter plunging into the hole with radial velocity ur c / 21/2 (where c is the velocity of light), but the rotation velocity reduces to rsu 4 km/sec.
To check the winding of the Milkyway spiral arms, it is noticed that the rotation velocity is in the order of 100 km/sec for a wide range of distance outside the core. Following this simplification, the spiral arms wind through a cycle of 360o in about 600 million years. Thus, it can be estimated from Eq.(17) that the change in the radial position of the arm is about 0.1 kpc. The observed separation of the arm from = 0 to 2 as shown in Figure 14 is about 20 kpc. This is obvious a contradiction, and that's why the simple spiral flow in galaxy from fluid dynamics consideration alone is at best a toy model as mentioned earlier.

The derivation is a little bit more involved for the hurricane. The attractive force Fr is replaced by the pressure gradient
Pressure Gradient dp/dr (which has overwhelmed the Coriolis and centrifugal forces in this case):
ur2 / r = (1/) dp/dr ---------- (20).
The dependence of p on r is shown in Figure 17b. The observational data (for the "Charlie" type hurricane) can be approximated by the empirical formula:
p = p0 [5.5 - e-k(r - re)] ---------- (21) for r re,
where re is the distance from the center to the wall of the eye (Figure 17b), p0 = 220 mb and k is a constant related to the steepness of the pressure gradient. Thus, the pressure gradient is:
dp/dr = kp0e-k(r - re) ---------- (22) for r re
or
ur2 = (krp0/) e-k(r - re) ---------- (23) for r re.
At the wall of the eye, r = re, and ur2 = krep0/.

Figure 17b Pressure Gradient of Hurricane [view large image]

The rotation curve is given by r2u2 = (kr3p0/b2) e-k(r - re), which reproduces a profile similar to the curve in Figure 17b with a maximum at rm = 3/k.
This kind of analysis is also applicable to the drain in the sink although on a much smaller scale.

Figure 17b offers a rough estimate of:
rm 40 km,
re 10 km,
and ur/(reu) 2 at re.
The followings can be derived from these data:
k = 3/rm 0.075 km-1,
b = [ur/(reu)] re 20 km.
Thunder Cell Thus the radial distance changes by about 125 km covering about 2/3 of the average hurricane size when turns one cycle. There is no tightly wound arms. This model seems to represent the actual system quite well. Meanwhile, the calculated radial and circular velocities at the wall of the eye are ur 4.6 m/h and reu 2.3 m/h respectively indicating a calm region there.
Figure 17c is a vivid example from a small scale hurricane (a thunderstorm supercell) over Montana, USA showing the wall, as well as the dark cloud spiralling inward.

Figure 17c Thunderstorm Supercell [view large image]

Go to Next Section
 or to Top of Page to Select
 or to Main Menu

.