
| Home Page | Overview | Site Map | Index | Appendix | Illustration | About | Contact | Update | FAQ |
|
|
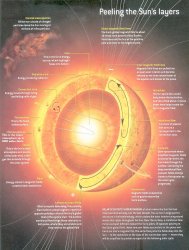
outward in the radiative zone, which occupies about 50% of the solar radius. The energy is then transported by means of convection out to the photosphere where the radiation becomes mostly visible light. Data for the Surface Temperature and Atmospheric Composition of the Sun in Table 07-01 are referred to the photosphere, which is the visible surface radiating the continuous spectrum. The atmosphere consists of an inner layer called chromosphere and an outer layer called corona where the gaseous density becomes more tenuous but the temperature increases to more than one million degree K and radiates mainly at extreme ultraviolet and x-ray wavelengths. Figure 07-04a shows the structure of the Sun in details. Figure 07-04b presents the different faces of the Sun according to different method of detection. The neutrino image is blurry due to poor resolution. Such detector has a resolution of 26o, whereas the Sun is only 0.5o wide (the little circle). |
Figure 07-04a The Sun [view large image] |
Figure 07-04b Different Faces of the Sun |
 |
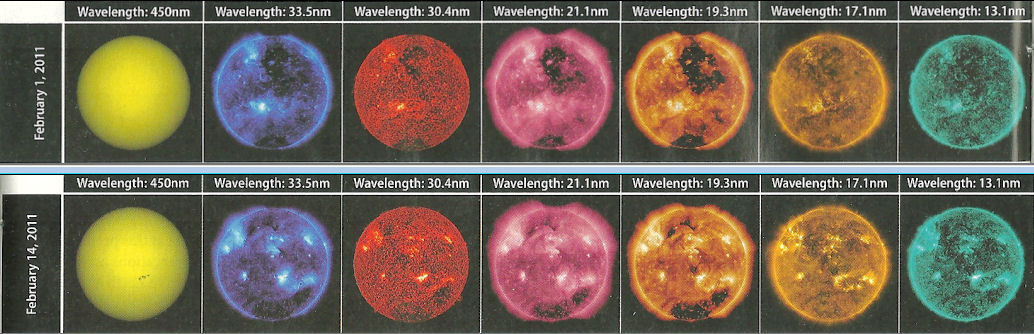 |
This kind of activity inhibits the convection and produces a cooler region relative to the background of the photosphere (Figure 07-04a). Figure 07-04d compares the quieter sun with the more active one (see a sunspot group located just to the lower right of the Sun's center, on February 14, 2011) viewing at wavelengths from visible light (far left) to extreme ultraviolet. |
Figure 07-04c Sun Spot 11-year Cycle |
Figure 07-04d Sun Spots [view large image] |
 |
A 2014 article in Nature describes a computer model which successfully reproduces the solar eruptions in December 2006. The mechanism is the emergence of localized magnetic flux, which is sometimes twisted by a particular pattern of the plasma flow. The twisted flux lines gradually accumulate magnetic energy until finally getting out of equilibrium and is "squeezed" upwards. Some of the ejected mass becomes solar wind while the rest falls back to the Sun. Figure 07-04e shows the evolution of the magnetic flux lines in three panels, the last one of which (diagram c) reaches a configuration in close agreement with the observation (diagram d). It is the subsequent reconnection that drives the mass ejection. Ultimately, the magnetic fields are generated according to the Ampere's Law (see insert in diagram a; for the case of the sun spot only upper part of the flux is visible, the rest is under the surface). |
Figure 07-04e Magnetic Flux |
See Solar Structure in "Stellar Structure" |
![[view large image]](I07-03-Sun.jpg)