
| Home Page | Overview | Site Map | Index | Appendix | Illustration | About | Contact | Update | FAQ |
 |
Statistics can be considered as experimental or observational mathematics. It uses the collected data to derive an estimated value of a parameter such as population mean, averaged temperature, ... etc. These values would not be very precise, but could present a vague idea in the absence of elaborate measurements, hence it is often associated with chance or probability. Many methods were invented over the years to check out the statistical significance of a given set(s) of data. Unfortunately, the data are often manipulated to suit some purposes, hence the saying : "There are three kinds of lies: lies, damned lies, and statistics". |
Figure 01 House Survey |
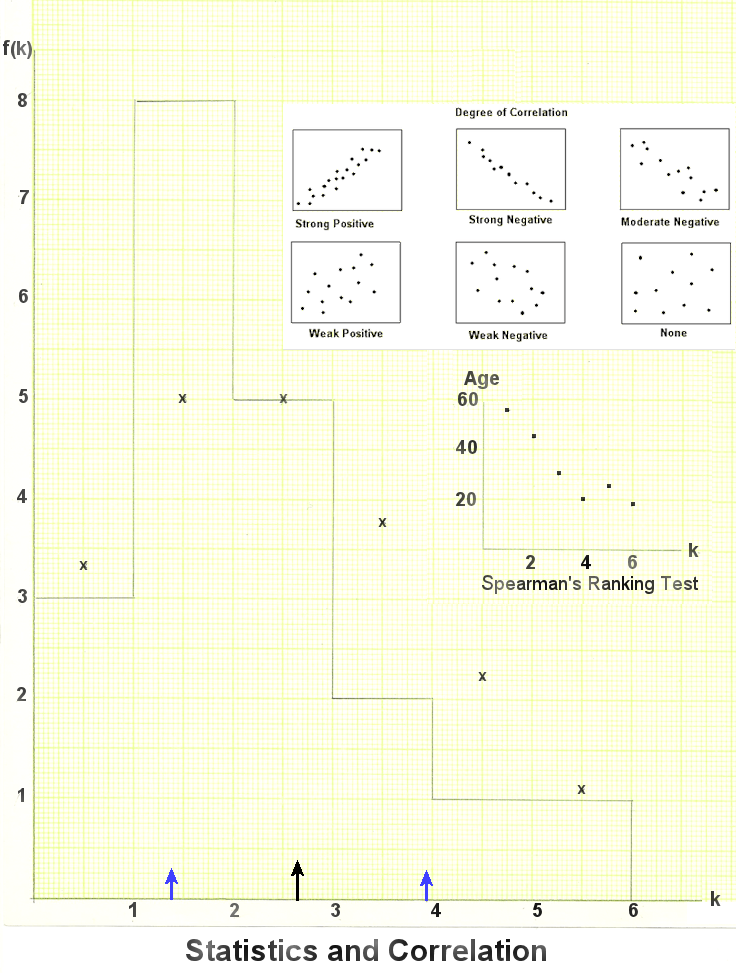
The following example illustrates the most elementary statistics about the number of occupants k in each of the N=20 houses on a street (Figure 01), f(k) denotes the frequency of occurrence hence f(k)/N is the probability of finding k occupants among these houses. It is often referred to as the Probability Distribution (note that its total is normalized to 1). Table 01 below contains the data collected in a survey. |
| k | f(k) | f/20 | kf(k) | Age |
|---|---|---|---|---|
| 1 | 3 | 0.15 | 3 | 56 |
| 2 | 8 | 0.4 | 16 | 45 |
| 3 | 5 | 0.25 | 15 | 30 |
| 4 | 2 | 0.1 | 8 | 20 |
| 5 | 1 | 0.05 | 5 | 25 |
| 6 | 1 | 0.05 | 6 | 18 |
 |

|
Figure 02 Statistical Graph |
From these statistical evaluations, we obtain a vague idea about the occupants on this street. However, many details such as gender, occupation, age, ... are missing. To obtain a little bit more information, the survey could include the averaged age of the occupants in each category as shown in the 5th column of Table 01. |
 ,
, = -0.94 indicating a strong negative correlation as shown in the upper insert in Figure 02. The lower insert shows the same thing with the actual data. In all csses,
  is a number between -1 (strong negative correlation) and +1 (strong positive correlation), a result of 0 means no correlation.
| k | k Rank | Age | Age Rank | d | d2 |
|---|---|---|---|---|---|
| 1 | 1 | 56 | 6 | -5 | 25 |
| 2 | 2 | 45 | 5 | -3 | 9 |
| 3 | 3 | 30 | 4 | -1 | 1 |
| 4 | 4 | 20 | 2 | 2 | 4 |
| 5 | 5 | 25 | 3 | 2 | 4 |
| 6 | 6 | 18 | 1 | 5 | 25 |
 |
The probability for a particular winning lineup (e.g., bronze to B, silver to A, gold to D) is just the reciprocal of the number of arrangements, i.e., P(5,3) = 1/60. This choice conveys a message or information about the selection of that year's winning contestants. The information can be quantified as I = - log2(N)  - 6 bits in the example. In the very unusual case where the winner of the crown can return to the pool to be judged again for the next crown, the number of contestants is always 5. Therefore the number of arrangements is 5 x 5 x 5 = 53 = 125. Thus nPk = nk in general for such case (see a less colorful example in Figure 03b). - 6 bits in the example. In the very unusual case where the winner of the crown can return to the pool to be judged again for the next crown, the number of contestants is always 5. Therefore the number of arrangements is 5 x 5 x 5 = 53 = 125. Thus nPk = nk in general for such case (see a less colorful example in Figure 03b).
|
Figure 03b Permutation Example |
 = n!/[k!(n-k)!] (for k = 0, 1, 2, ... n) in the Binomial Theorem specify the occurrence frequency of the various outcomes in n trials :
 an-kbk + ... + nabn-1 + bn.
 |
 |
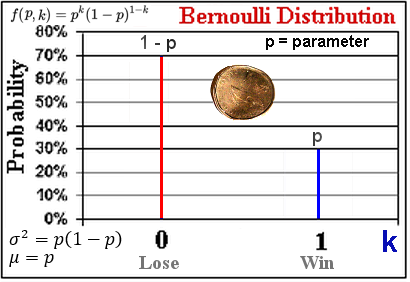
As shown in Figure 05, since the events are always simultaneously opposite to each other the distribution is symmetrical about the mid-point. When the Binomial coefficients are normalized by dividing the sum of all the  's, which is just 2n, they becomes the probabilities. The Bernoulli distribution is the special case of (a + b)n with n = 1 (k = 0, 1) showing both events occur once at the same time. The discrete Binomial distribution can be approximated by the continuous Normal distribution (aka the Bell curve) with k 's, which is just 2n, they becomes the probabilities. The Bernoulli distribution is the special case of (a + b)n with n = 1 (k = 0, 1) showing both events occur once at the same time. The discrete Binomial distribution can be approximated by the continuous Normal distribution (aka the Bell curve) with k  x : x :
|
Figure 04 Bernoulli Distribution |
Figure 05 Binomial Distribution [view large image] |
 . .For the case of n = 6, p = 0.5:  = 3, = 3,  = 1.2247, f(3) = 0.3258 (see Figure 05). = 1.2247, f(3) = 0.3258 (see Figure 05). |
 )/
)/ , then dt = dx/
 .
. -
-  to
to  +
+  (correspondingly t runs from -1 to +1); then according to the table, the entry is 0.6827 or 68.27%. It is from this value, the quality of the measurements are assessed. If the range is from x =
  - 3
- 3 to
to  + 3
+ 3 , then the probability is 99.73%. In general the range is defined as from x =
  - x
- x  to
to  + x
+ x  , where x is a multiplying factor for
  and is the integration limits in the table, i.e., x =
  (x -
(x -  )/
)/ for a measured value of x.
 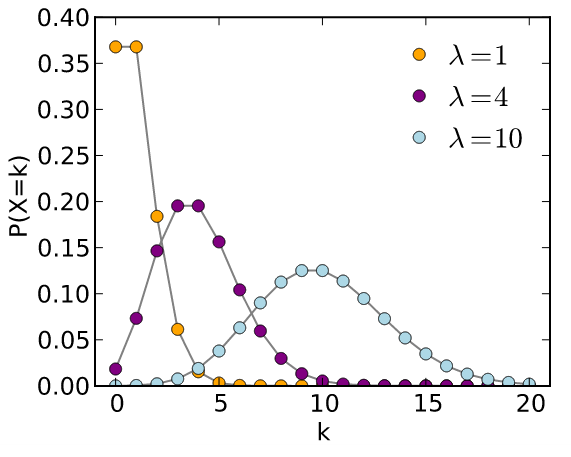 |
The Poisson distribution is used for estimating random occurring phenomenon based on a more likely one. The formula is : where  is called the "intensity", which is usually associated with the more frequent occurrence. In the example of occupants number, is called the "intensity", which is usually associated with the more frequent occurrence. In the example of occupants number,  = 3 (at k = 3) seems to fit better. The result is plotted with crosses (x's) in = 3 (at k = 3) seems to fit better. The result is plotted with crosses (x's) in
|
Figure 06 Poisson Distribution [view large image] |
Figure 2 (by scaling with a multiplication factor of 22.22). Figure 06 shows that the Poisson Distribution approaches the Normal Distribution as   10 10 |
 |
 |
Quantum physics depends extensively on the probability distribution of small particles to understand the nature of microscopic objects. A very simple example is about a particle inside a box, which is represented by an infinite square well. The probability distribution is in the form of P(x) = sin2(nx), where n is an integer specifying the state of the system, which is associated with the energy level in this case. A few of the probability distribution are shown in Figure 07. Another exactly solvable case for the Schrodinger's equation is the Hydrogen atom. The probability distribution is related to the electron (probability) density around the nucleus - the proton. A few of the states are displayed in Figure 08 for its radial distribution. These states are also |
Figure 07 Infinite Square Well Probability [view large image] |
Figure 08 H Atom Distribution [view large image] |
related to the energy level, but there are more complicated configuration involving orbital angular momentum, spin, ... Some of such states are |
 , which is related to the probability P =
  *
* . The quantum number l > 0 is related to orbital angular momentum (see images in the lower right quadrant). The small insert is a real image obtained from a quantum microscope.
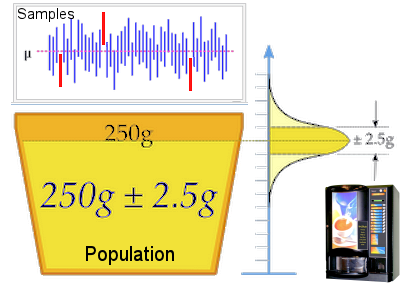 |
A confidence interval (CI) is the interval for sets of measurements, which are likely to including the unknown parameter, e.g., the mean of the population sample  to be verified (see top portray in Figure 09). The technique requires a knowledge of the population standard deviation to be verified (see top portray in Figure 09). The technique requires a knowledge of the population standard deviation  as shown in the following example. as shown in the following example.A coffee vending machine customer decides to check out the manufacturer's specification, which claims to dispense 250 g (the  ) of the liquid with a margin of error to be 2.5 g (the ) of the liquid with a margin of error to be 2.5 g (the  as shown in Figure 09). The procedure to determine if the machine is adequately calibrated, is to weigh n = 25 cups of the stuff, i.e., x1, x2 ... x25, and to perform the following calculation. Data from both the manufacturer (taken to be the as shown in Figure 09). The procedure to determine if the machine is adequately calibrated, is to weigh n = 25 cups of the stuff, i.e., x1, x2 ... x25, and to perform the following calculation. Data from both the manufacturer (taken to be the
|
Figure 09 Confidence Interval [view large image] |
whole population) and the customer's sample are considered to follow the pattern of normal distribution. Sample data gathering in this case has 50 sets of 25 cups each as shown in the top portray in Figure 09. |
 |
 |
Normal Probability Table |
This example shows that the estimate of  becomes more accurate as the CI getting narrower. This objective can be achieved with increasing n, i.e., by collecting more data in the sampling. However, it implies more work, which is especially more difficult in the old day when calculation was not computerized. becomes more accurate as the CI getting narrower. This objective can be achieved with increasing n, i.e., by collecting more data in the sampling. However, it implies more work, which is especially more difficult in the old day when calculation was not computerized. |
 and s) are computed from a smaller dataset than the population's. The results are generally not the same as the population's (denoted by
  , and
, and  ). The "Central Limit Theorem" states that, for large sample,
the sample means (
 's) from normally distributed samples are also normally distributed, with the same expectation
  , and a standard error of
  /(n)1/2 of the population, which is also normally distributed.
  |
The confidence level is used for the search of the Higgs particle by scientists in LHC. They first calculate all the possible events excluding those related to the Higgs' from the Standard Model. This is the  / / SM = 1 straight line in Figure 10 (don't confuse it with the standard deviation). Then the probability SM = 1 straight line in Figure 10 (don't confuse it with the standard deviation). Then the probability  / / SM for similar Higgs-looking background events are estimated and plotted by the yellow and green bands with 95% CL with the SM for similar Higgs-looking background events are estimated and plotted by the yellow and green bands with 95% CL with the
|
Figure 10 CL in Higgs Discovery [view large image] |
mean (dark dotted curve) in Figure 10. The occurrence of rare events outside the expected boundary indicates additional contribution by the Higgs particles, the the corresponding energy (~ 125 Gev) is the mass of the Higgs particle. The ultimate goal is to obtain a signal at 99% CL. |

 2 points to a certain p-value =
  , which is compared with 0.05 to determine whether to accept or reject the null hypothesis. The mathematical formula for this distribution and a few graphs for different k are shown in Figure 11a. The statistical hypothesis test is valid to perform if the test statistic is chi-squared distributed under the null hypothesis. There is also a table for different value of
  2
2 with various df (where
  is related to x =
  2 by
2 by  ).
).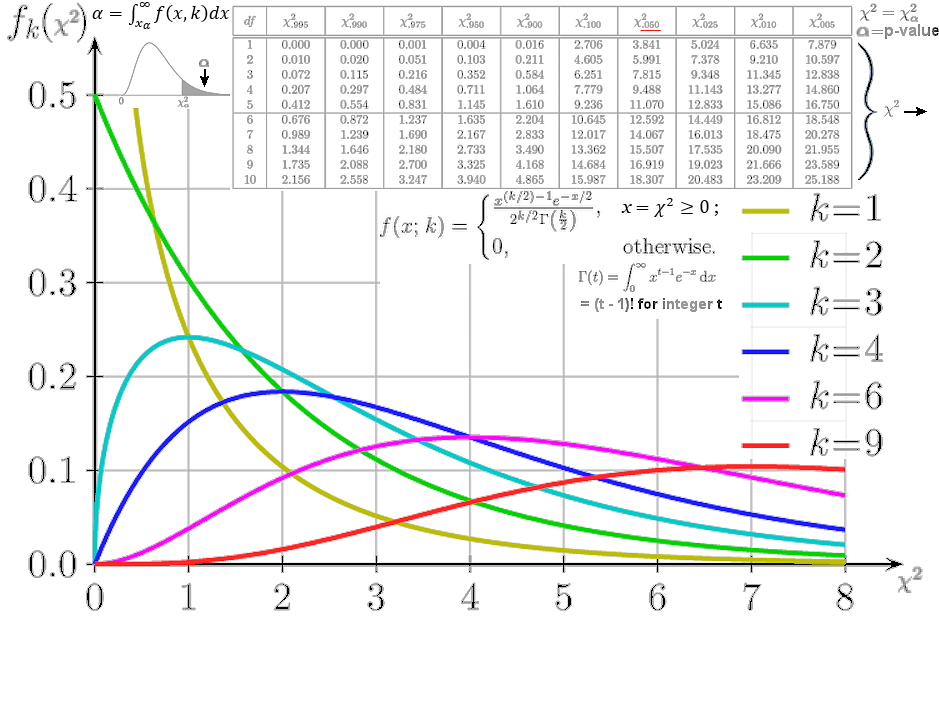 |
The Chi Square Test is a tool to check out if the measurements relate to a hypothesis is true or not. It was originally intended to judge if the statistical data are significant. It doesn't even come up with a degree of correlation as provided by the Spearman's test. However, it becomes a gold standard for evaluating statistical data over the years since its invention in the 1920's. There is a 2014 article in Nature to remind everyone to use it carefully. A table of  2 2 and graphs of f( and graphs of f( 2 2 ) for different k is shown in Figure 11a. The subscript ) for different k is shown in Figure 11a. The subscript  in in  2 2 on the top row is the % probability beyond on the top row is the % probability beyond  2 2 as shown by the dark shade inside the curve at top left. Usually, as shown by the dark shade inside the curve at top left. Usually,  denotes the probability that the null hypothesis (the measurements are related to the denotes the probability that the null hypothesis (the measurements are related to the
|
Figure 11a Chi Square Distribution |
assertion) is right. Thus a small nummber for  indicates that the null hypothesis is probably wrong. The boundary is set at indicates that the null hypothesis is probably wrong. The boundary is set at  2 2 =0.05. The p-value = =0.05. The p-value =  = 0.05 is arbitrarily chosen but accepted by most researchers. A value of = 0.05 is arbitrarily chosen but accepted by most researchers. A value of  2 to its left (smaller 2 to its left (smaller  , larger , larger  ) means support for the hypothesis, and otherwise to the right. ) means support for the hypothesis, and otherwise to the right. |
 2 is smaller or greater than
  20.05. It is a way of just providing a YES or NO answer to the likelihood of the null hypothesis.
 |
By definition x = =  2 2 is calculated from is calculated from  , which is not easy to solve even numerically. Fortunately, "Stat Trek" has provided an online Chi-square calculator to facilitate the difficult task (click Figure 11b). The CV in there denotes the x , which is not easy to solve even numerically. Fortunately, "Stat Trek" has provided an online Chi-square calculator to facilitate the difficult task (click Figure 11b). The CV in there denotes the x , while P(X2 , while P(X2  CV) denotes the percentage probability for the integration limits from 0 to x CV) denotes the percentage probability for the integration limits from 0 to x producing (1 - producing (1 -  ). It is available for different values of k up to k = 50. ). It is available for different values of k up to k = 50.
|
Figure 11b Online Chi2 Calculation |
For the novice, it is important to distinct the difference between  2 (or x, the independent variable) and the 2 (or x, the independent variable) and the  (or p-value, the sum of probability). Also notice that increasing (or p-value, the sum of probability). Also notice that increasing  2 always goes together with decreasing 2 always goes together with decreasing  . . |
 2 in some cases :
 ,
, 0, where k is the degree of freedom. The Chi-squre distribution has some remarkable properties, which can be verified easily for integer k/2 by virtue of the following integral :
  , i.e.,
 = k.
= k. 2 = 2k.
 2). See Figure 11c for a pictorial illustration with the k = 4 Chi-square distribution curve (in red).
 ; the Chi-squre distribution approaches the normal distribution. By substituting x =
  - x' and then x =
  + x' (with k
  x'
x'  0) to f(x), it reveals f(x)
  (1 - x'2/4) for both substitutions proofing that f(x) is symmetrical about the mean
  .
. 20.05 is chosen such that
  20.05 >
  +
+  = k + (2k)1/2 for all k's. In particular, for large k and with minor adjustment (to the usage of the Normal Probability Table) an approximate expression can be derived :
  20.05 = k + 1.78 (2k)1/2. It yields good agreement with the online calculation giving 67.8 (vs 67.5) for k = 50; and 18.0 vs 18.3 for k = 10.
 |
|
Figure 12 Contingency Table |
There is always one degree of freedom less because of the restriction imposed by the sum. |
 |
The expected frequencies are computed by the formula Er,c = (nr x nc)/n, where nr, nc are the row and column totals, n is the grand total number in the survey. The Er,c's have the effect of blurring the distinction between the political parties and genders and so represent the |
Figure 13 Frequency Table |
null hypothesis. Or,c's are the raw data from the survey as shown within the red line boundary in Figure 12. These data are collectively shown in the frequency table in Figure 13. |
 2 = 0.176 . According to the table in Figure 11a for df = 2, it produces a p-value much greater than the 0.05 level. It is thus concluded that the probability (p-value) is high enough to sustain the null hypothesis, i.e., there is no correlation between genders and voting preferences. This kind of statistical evaluation is valid only if (a) the sample is random, (b) the population is at least 10 times as large as the sample, (c) the frequency count is at least 5, (d) the variable under study are each categorical.
 |
 2 = 2.27. For df = 4 - 1 = 3, the Chi Square Table in Figure 11a indicates a p-value between 0.9 and 0.1, i.e., greater than the 0.05 significance level. The gambler proceeds to play with re-gained trust. 2 = 2.27. For df = 4 - 1 = 3, the Chi Square Table in Figure 11a indicates a p-value between 0.9 and 0.1, i.e., greater than the 0.05 significance level. The gambler proceeds to play with re-gained trust. |
Figure 14 Three Dice Gambling [view large image] |
The formula is :  where Oi is the observed frequency, Ei the expected frequency as asserted by the null hypothesis, and n the number of cells to be evaluated. For perfect match, Oi = Ei,  2 = 0, 2 = 0,  = 1. = 1. |
| # of Sixes | Observed Counts Oi | Expected Counts Ei |
|---|---|---|
| 0 | 64 | 1(5/6)(5/6)(5/6)x100 = 58 |
| 1 | 30 | 3(5/6)(5/6)(1/6)x100 = 34.5 |
| 2 | 5 | 3(5/6)(1/6)(1/6)x100 = 7 |
| 3 | 1 | 1(1/6)(1/6)(1/6)x100 = 0.5 |
 2 = 0 <<
  20.05. The null hypothesis is 100% correct.
  2 ~ 4k >
  20.05 according to the estimated value of
  20.05. Thus, the null hypothesis can certainly be rejected.
  2 ~ k <
  20.05 implying the rejection of the null hypothesis is not solid.
 |
According to the article in Nature (as mentioned earlier), the problem of relying on the p-value is in the underlying hypothesis, which challenges the null hypothesis. As shown in Figure 15, the more outlandish the hypothesis the more chance it would fail even at the 0.01 level. In other words, the significance p-value varies with the nature of the hypothesis, 0.05 is not the absolute standard as most researchers assumed. A subjective element about the likelihood of the hypothesis is thus introduced into the process. On top of such fallacy, there are cases when data |
Figure 15 Statistical Errors [view large image] |
are massaged to yield a low p-value. It is suggested that claims of p-value around 0.05 often involves fishing for significance; failure to replicate results is another sign; p-hacking (manipulation of data) can also be detected by looking at the method of analysis often banished to the discussion section at the end of the paper. |
 |
Boltzmann in 1868. The atomic composition of gas was not widely accepted by physicists at that time, and nothing was known about atomic structure; thus, the micro-state was invented to accommodate the particles with population Ni in an energy state Ei, which contains a number of cells gi (corresponding to different orientations for example). These micro-ensembles are supposed to link with the macroscopic variables such as the total number of particles N =  Ni, the total energy E = Ni, the total energy E =  NiEi, the volume of the system V, temperature T, ... The probability of the ith occurrence would be Ni/N, the distribution (against energy or velocity) of which was derived by Maxwell-Boltzmann under certain assumptions : NiEi, the volume of the system V, temperature T, ... The probability of the ith occurrence would be Ni/N, the distribution (against energy or velocity) of which was derived by Maxwell-Boltzmann under certain assumptions : |
Figure 16 Maxwell-Boltzmann Distribution [view large image] |


 Ni and E =
  NiEi. The method of "Lagrange Multipliers" is used to perform such kind of maximization. Essentially, if the constraint for f(x) is in the form h(x) = 0, then the maximizing should be performed on L(x,
 ) = f(x) +
  h(x), where
  is a constant (the Lagrange multiplier) to be determined. In the current derivation, it is easier to deal with ln(W) in the following maximizing scheme :
 + 1)N +
  E.
E. dE. Since the Boltzmann's definition of entropy is S = k ln(W), thus dS/k =
  dE, where the Boltzmann constant k = 1.38x10⁻¹⁶ erg/K.
 |
In thermodynamics, the infinitesimal change in energy is related to the other macroscopic variables by the identity : dE = TdS - pdV +  dN, dN,where T is the temperature, p the pressure, and  the chemical potential related to the change of chemical energy G with the change in the number of ith species Ni, i.e., the chemical potential related to the change of chemical energy G with the change in the number of ith species Ni, i.e.,  = dG/dNi (Figure 17). Since both the volume V and number of particles N are unchanged in the Maxwell-Boltzmann statistics, dE = TdS. By comparing the formula derived from the microscopic consideration, i.e., dE = dS/( = dG/dNi (Figure 17). Since both the volume V and number of particles N are unchanged in the Maxwell-Boltzmann statistics, dE = TdS. By comparing the formula derived from the microscopic consideration, i.e., dE = dS/( k), the Lagrange multiplier can be identified as k), the Lagrange multiplier can be identified as  = 1/kT. = 1/kT.
|
Figure 17 Chemical Potential [view large image] |
 v2 with each direction of the velocity represents a different cell (Figure 16). The probability of finding the particles with velocity v is :


 p = p - (-p) = 2p = 2mv in a time interval
  t = 2L/v. By definition, the pressure P = F/A = N(
 p/
p/ t)/A = Nmv2/V or v2 = PV/Nm, where F is the collective force from N particles and the volume V = LA. Using the relationship between v and T, we obtain the Gas Law PV = nRT, where n = 3N/NA is the number of mole for 3N particles, R = kNA = 8.314 J/mole-K the Gas constant.
  |
 |
In deriving the Bose-Einstein distribution, it is assumed that the constituent gas particles are non-interacting at thermodynamic equilibrium and indistinguishable. There is no restriction on the number of particles in any quantum states. They are called boson, all of them have integer spin. Those are photon gas in the cavity of blackbody radiation, the coupled electron pair (Cooper pair) in superconductivity, and Helium-4 in Superfluidity. |
Figure 19 BE-MB Distribution |
Figure 20 BE-FD Distribution [view large image] |
The methodology to derive the statistical distribution is similar to the treatment in the last section. The difference is on counting the occupation number. |
 (Ni + gi - 1)! / [Ni! (gi - 1)!]
 ;
;
 (Ni + gi)Ni+gi/[(Ni)Ni(gi)gi] ~
  giNi/Ni!
 N +
N +  E.
An infinitesimal change in energy and number of particles would induce a small adjustment of the configuration :
  dN +
dN +  dE.
dE. dN,
dN, the chemical potential related to the change of chemical energy G with the change in the number of ith species Ni, i.e.,
  = dG/dNi (Figure 17). Since the volume V is constant, dE = TdS +
  dN. By comparing the formula derived from the microscopic consideration, i.e., dE = dS/(
 k) - (
 /
/ )dN, the Lagrange multipliers can be identified as
  = 1/kT, and
  = -
= - /kT , and
Ni = gi / [e(Ei -
  )/kT - 1] .
 |
 |
(5) Photon Gas in Cavity - Photon gas is the quantum version of electromagnetic wave when the particle-like behavior is dual to the wave property. It's main difference from the ideal gas is the way in reaching equilibrium. Whereas that state is attained by collisions in the latter case and the number of particle is conserved, the photon gas arrived at equilibrium by interacting with the matter in the cavity wall (Figure 21). The number of photons in a given state is not constant in the absorption and emission processes. However, the total energy remains the same at equilibrium, i.e., the total negative change of the chemical potential is balanced by the positive change. |
Figure 21 Photon Gas |
Figure 22 Blackbody Radiation [view large image] |
Consequently, the overall change is zero which implies the chemical potential  = 0 or e- = 0 or e- /kT = 1. /kT = 1. |
 p2dp where V is the volume of the cavity, p is the momentum of the photon (with energy h
 = pc), and the factor of 2 is for the 2 different polarization states. The Planck's constant h = 6.625x10⁻²⁷ erg-sec from the uncertainty relation
  p
p x ~ h in quantum theory is conveniently taken as the basic unit (minimum size) of the microscopic states. Thus gi = (V/h3)8
 p2dp.
p2dp.

 max ~ 480 nm (Figure 22), which is in the middle of the visible range and absorbed by plants to perform photosynthesis in the first step of the food chain.
 ; there would be only one arrangement for gi = Ni :
  .
. gi! / [Ni! (gi-Ni)!] .

 +
+ Ei >> 1 (i.e., when the particles behave like ideal gas, see Maxwell-Boltzmann statistics) and substituting the optimized value of Ni into ln(W) :
 N +
N +  E.
An infinitesimal change in energy and number of particles would induce a small adjustment of the configuration :
  dN +
dN +  dE.
dE. dN,
dN, the chemical potential related to the change of chemical energy G with the change in the number of ith species Ni, i.e.,
  = dG/dNi (Figure 17). Since the volume V is constant, dE = TdS +
  dN. By comparing the formula derived from the microscopic consideration, i.e., dE = dS/(
 k) - (
 /
/ )dN, the Lagrange multipliers can be identified as
  = 1/kT, and
  = -
= - /kT , and
Ni = gi / [e(E -
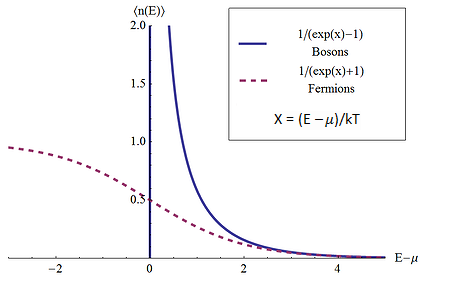
  )/kT + 1], or in the form of the continuous occupation index (probability for occupation of each cell at energy E) f(E) = N(E)/g(E) = 1 / [e(Ei -
  )/kT + 1].
 (fully occupied), and f(E) = 0 for E >
  (none occupied). For finite temperature, more levels would be populated as T increases for E >
  , while the opposite trend happens for E <
  . The chance is always 1/2 at E =
  (see Figure 23). It will be shown presently that
  depends on the number density N/V. It is better known as Fermi Energy EF .
  |
Derivation of the number of cells gi is similar to the case of Bose-Einstein statistics counting in phase space: Vx2x4 p2dp where V is the volume of the cavity, p is the momentum of the electron, and the factor of 2 is for the 2 different spin states. The Planck's constant h = 6.625x10⁻²⁷ erg-sec from the uncertainty relation p2dp where V is the volume of the cavity, p is the momentum of the electron, and the factor of 2 is for the 2 different spin states. The Planck's constant h = 6.625x10⁻²⁷ erg-sec from the uncertainty relation  p p x ~ h in quantum theory is conveniently taken as the basic unit (minimum size) of the microscopic states. Thus gi = (V/h3)8 x ~ h in quantum theory is conveniently taken as the basic unit (minimum size) of the microscopic states. Thus gi = (V/h3)8 p2dp. p2dp.
|
Figure 23 Fermi-Dirac Statistics [view large image] |
In terms of energy E = p2/2m, g(E) dE = [(8 V V m3/2E1/2)/h3] dE . m3/2E1/2)/h3] dE . |

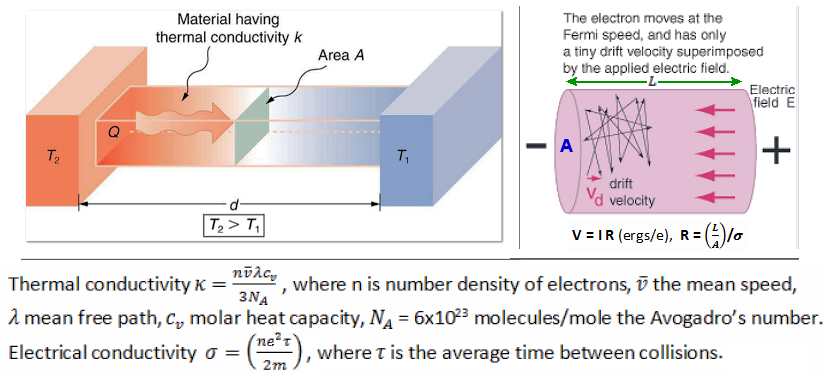 |
Table 04 lists the electrical and thermal conductivity for some metals in descending sequence of EF. Theoretical calculations show that these conductivities are proportional to the electron number density (Figure 24). The table reveals that while some entries follow the trend, the others (the latter half) do not seem to conform. The deviation can be explained by interaction with phonons (coherent wave motion of the lattice), which determines the conductivity for some metals. |
Figure 24 Conductivity by Electron Gas |
| Metal | Fermi Energy, EF (ev) | # Density (1028/m3) | Electric Conductivity (107/ohm-m) | Thermal Conductivity (w/m-K) |
|---|---|---|---|---|
| Aluminium (Al) | 11.7 | 18.1 | 3.50 | 205.0 |
| Iron (Fe) | 11.1 | 17.0 | 1.00 | 79.5 |
| Lead (Pb) | 9.47 | 13.2 | 0.455 | 34.7 |
| Copper (Cu) | 7.0 | 8.47 | 5.96 | 385.0 |
| Silver (Ag) | 5.49 | 5.86 | 6.30 | 406.0 |
| Sodium (Na) | 3.24 | 2.40 | 2.22 | 134.0 |