| Home Page | Overview | Site Map | Index | Appendix | Illustration | About | Contact | Update | FAQ |
|
|
The Wilkinson Microwave Anisotropy Probe (WMAP) team has released the first detailed full-sky map of the oldest light in the universe on February 11, 2003. Figure 02-09aa shows the measurements with red indicates "warmer" and blue indicates "cooler" spots. The patterns in the map are tiny temperature differences within an extraordinarily evenly dispersed microwave radiation bathing the Universe, which now averages a frigid 2.73 degrees above absolute zero temperature. WMAP resolves the slight temperature fluctuations, which vary by only millionths of a degree. Analyses of this microwave radiation emitted only 380,000 years after the Big Bang appear to define our universe |
Figure 02-09aa High Resolution CMBR |
more precisely than ever before. Measurements from WMAP resolve several long-standing disagreements in cosmology rooted in less precise data. |
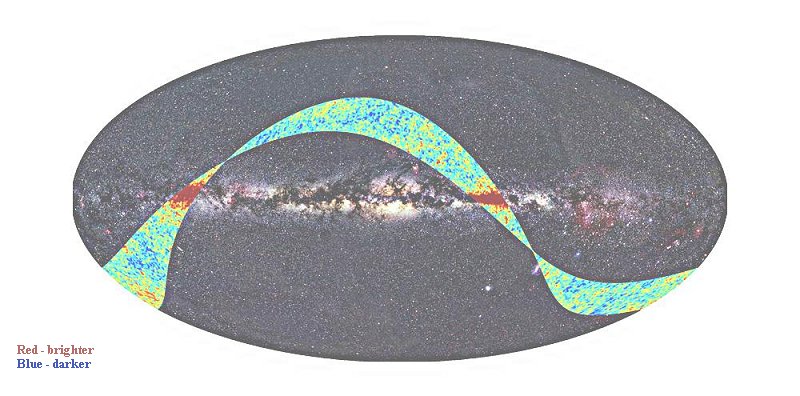 |
(1 - 0.033 cm). It will yield the most accurate map yet of the CMBR. The first image of a strip of the millimeter wavelength sky (Figure 02-09ab, from Planck in September 2009) shows that all systems are working well. Routine operations will continue for at least 15 months without a break. In this time, Planck will be able to gather data (at 9 different wavelengths) for two full independent all-sky maps. To fully exploit the high sensitivity of Planck, the data will require a great deal of delicate calibrations and careful analysis. It will keep cosmologists and astrophysicists busy for decades to come. |
Figure 02-09ab First Image from the Planck Satellite |
See Planck Update below from an ESA news about the latest (2013) cosmic parameters. |
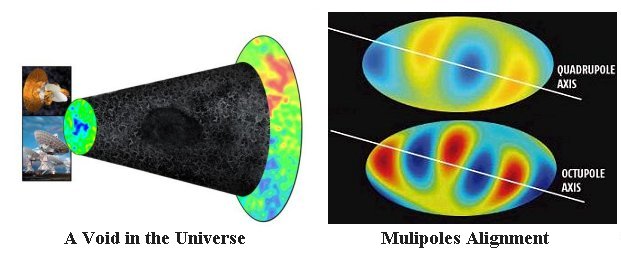 |
1. It has been deduced from the absence of radio sources that there is a big hole in the sky devoid of both normal and dark matter in the direction of the constellation Eridanus. Its size is nearly a billion light years across at a distance 6 - 10 billion light years away (40 times larger in volume than the previous record holder). The void coincides with an extra large cold spot in the WMAP map covering a few degrees of the sky (many times more than the full moon). The temperature of the void is between 20 and 45 % lower |
Figure 02-09b WMAP Oddities |
than the average. It is suggested that the discovery of the void ties in neatly with the WMAP cold spot and the existence of dark energy as the photons would lose energy passing through an empty space. |
 |
Anyway back in 2009, a theory based on the multiverse aspect of the string theory claims that the dynamic effect of matter and gravity would have weeded out the majority of string vacuums, leaving only our patch and close neighbours in the string landscape. A calculation shows that interaction between neighbouring patches in early epoch would leave the universes in an entangled state linking them together even when their separation is space-like (meaning they cannot interact with each other in the usual way). It predicts that pushing and squeezing between the patches will produce voids on the scales of about 1/2 billion light year. The alignment in the lower multipoles is the byproduct of such interaction, which squeezes our universe on one side, perhaps shaped it like a pancake. This theory may point us to the first glance of another universe after all kinds of speculation in science fictions. |
Figure 02-09c The Void |
 |
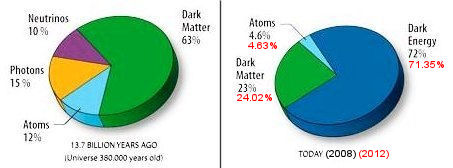 |
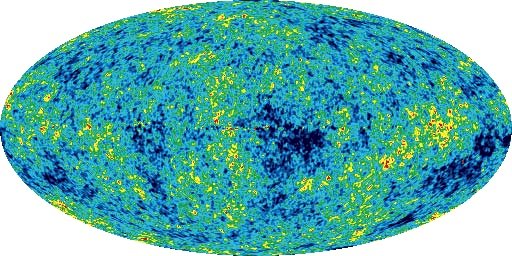
The NASA/WMAP Science Team presents the cosmic microwave temperature fluctuations from the 5-year WMAP data (Figure 02-09d) on March, 2008. The composition of the early universe has been measured from the data as shown in Fiugre 02-09e. It is obvious by comparing with the composition in the current epoch that it varies as the universe expands. It appears that the dark energy density does not |
Figure 02-09d WMAP 5-Year Data [large image] |
Figure 02-09e Early Universe |
decrease at all, so it now dominates the universe even though it was a tiny fraction 13.7 billion years ago. Other major findings include: |
 |
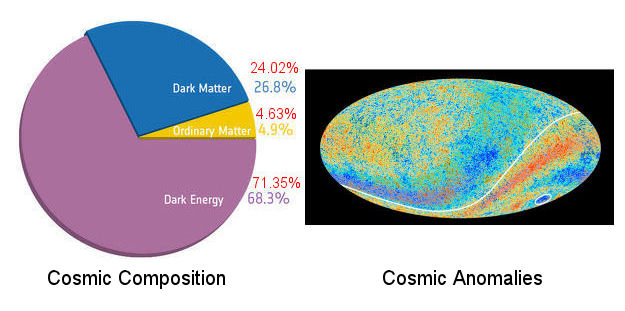 |
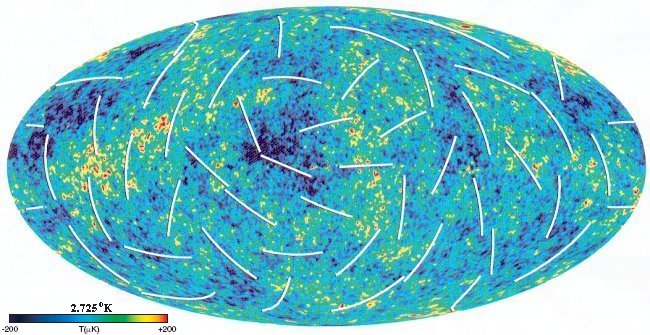
collected by the Planck space telescope. As shown in Figure 02-09f, the CMBR map conform well to the simple model of the universe with inflation and expansion. The composition (Figure 02-09g) is slightly different from those by WMAP (2012 data in red). The suspect anomalies in WMAP also show up in the Planck map in the forms of a cold spot (or hole) and an asymmetry in the average temperatures on opposite hemispheres of the sky |
Figure 02-09f CMBR Map by Planck [view large image] |
Figure 02-09g Planck's Cosmic Measurements |
- the axis of evil (white line in Figure 02-09g). The Hubble constant is 67.15 km/sec-Mpc as measured by Planck corresponding to an age of 13.82x10⁹ years for the universe. The map even shows that the number |
 |
The Planck data also reveal a discrepancy in galactic cluster mass as predicted by standard cosmology and measured by the Sunyaev-Zeldovich effect, which bumps up photon energy by interacting with the hot gas in the cluster. Two 2014 studies of gravitational lensing suggest that there is no missing mass as estimated by the Sunyaev-Zeldovich effect (Figure 02-09h). The new measurements yield an average cluster mass of 1015 Msun similar to the estimate from Virial Theorem. These reports may disappoint those physicists who desperately look for shred of evidences or flimsy excuses to promote their brand of exotic physics. |
Figure 02-09h Galactic Cluster Mass [view large image] |
 |
 |
The Planck team presented the latest CMB analysis (based on all four years of observations) to the press on December 01, 2014 in Ferrara, Italy, during a Planck 2014 conference. It reaffirms the standard model of cosmic evolution, but puts into question AMS's earlier claim on the detection of dark matter. The six major issues (Figure 02-09i) addressed in the conference are described briefly in the followings. |
Figure 02-09i Planck 2014-12-01 [view large image] |
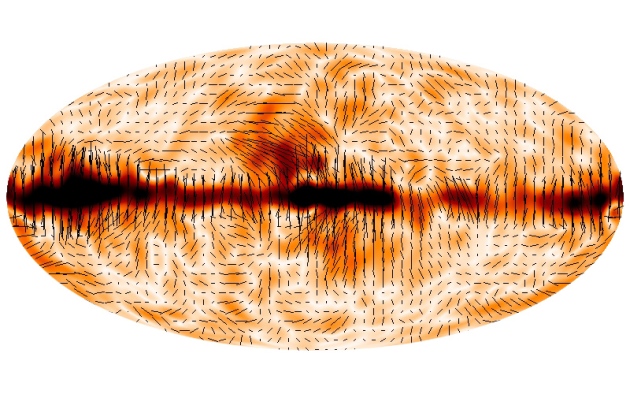
Figure 02-09j Polarization 2014-12-01 [view large image] |
 |
 |
see aren't set by instruments, which can measure down to 0.07K or so, but by the fundamental astrophysics of the Universe itself! In other words, it will be impossible to ever take better pictures of this stage of the Universe than Planck has already taken." So it could be the end of an era as funding would not be forthcoming for an already completed mission. The conclusion from the latest data confirms that the universe is consistent with the  CDM model as portrayed CDM model as portrayed
|
Figure 02-09k CMB Legacy |
Figure 02-09l Cosmological |
in Figure 02-09l, i.e., it is mostly composed of vacuum energy and Cold Dark Matter. Their cosmic data are described briefly below : |
 = 68.3%. As the w parameter w = -1.03 is found in the current report, it suggests that the vacuum energy denstiy is consistent with the vacuum energy density as prescribed by the constant term in General Relativity. See "Vacuum Energy Density". D = 26.8%, its property is unknown. See "Dark Matter, 2018 Update".B = 4.9%. See "Insignificance".M = D + B = 31.7%.
 kns-1, where the wavenumber of the fluctuations k = 2
 /
/ , and ns is referred to as the scalar spectral index with ns = 1 corresponding to scale invariant fluctuations. This parameter describes the initial clumping of matter in space. The clumping in turn produced the galaxies and clusters of galaxies we see today. If ns ~ 1, the "primordial" perturbations was the same on all physical scales, leading to the formation of similar structures on all scales, their spectrum is said to have no tilt. Planck 2018 reports ns = 0.965 which is consistent with the simplest inflation models. See "Quantum Fluctuations and Cosmic Structures".
![[view large image]](I02-20-cgmass.jpg)